Emerging Markets ETFs on the ASX: How to Access India, China, Asia, and the World's Fastest-Growing Economies

There are 29 ETFs on the ASX covering emerging markets, Asia, China, India, Japan, and Korea — with a combined $11.3 billion in assets under management. These funds give Australian investors access to economies that represent roughly 80% of the world's population and the lion's share of global GDP growth over the next two decades.
But here's the thing most investors miss: if your core portfolio is built around VGS or BGBL, you hold zero emerging markets exposure. Both ETFs track developed markets only — the US, Europe, Japan, Canada. The fastest-growing economies on the planet are completely absent. This guide covers every ASX-listed option to fix that gap, with full data on all 29 funds.

What Are Emerging Markets? Which Countries Are Included?
"Emerging markets" is a catch-all term for economies that are growing fast but haven't yet reached developed-market status. The standard benchmark is the MSCI Emerging Markets Index, which covers 24 countries across Asia, Latin America, and Europe/Middle East/Africa (EMEA).

Here's how the index breaks down by region:
Asia (the dominant region)
China: ~24%
India: ~20%
Taiwan: ~18%
South Korea: ~11%
Thailand: ~2%
Indonesia: ~2%
Malaysia, Philippines (smaller weights)
Latin America
Brazil: ~5%
Mexico: ~3%
Chile, Colombia, Peru (smaller weights)
EMEA (Europe, Middle East & Africa)
Saudi Arabia: ~4%
South Africa: ~3%
UAE, Qatar, Kuwait, Turkey, Egypt, Poland, Czech Republic, Hungary, Greece
The key number to understand: China + India + Taiwan alone account for roughly 62% of the index. When you buy a broad EM ETF, you are primarily buying those three countries. If you have a strong view on one of them — positive or negative — that changes how you should construct your EM exposure.
Why does emerging markets matter for your portfolio?
The structural case is compelling. EM economies grow faster than developed markets. They have younger, growing populations. An expanding middle class is driving domestic consumption at scale. Urbanisation is still in progress across large parts of Asia and Africa — a process that took decades in developed markets is happening in years. India's GDP is growing at roughly 6–7% annually, against the 1–2% typical of Western economies.
But the risks are real and different in nature. Political risk is higher — governments change policy suddenly and sometimes unpredictably. Currency volatility can wipe out equity gains (or amplify them). Corporate governance standards are weaker on average. Liquidity can dry up quickly in a risk-off environment. This is why EM equities have historically delivered higher long-run returns — but with far more volatility.
For more on why global diversification matters in the first place, see Australian vs Global Shares: 15 Years of ETF Data.
1. Broad Emerging Markets ETFs
8 funds — $4.7B AUM
ETF | Name | AUM | MER | 1Y Return | 3Y Return | 5Y Return |
|---|---|---|---|---|---|---|
Vanguard FTSE Emerging Markets | $1,789M | 0.48% | +15.9% | +46.8% | +31.9% | |
iShares MSCI Emerging Markets | $1,603M | 0.69% | +30.0% | +62.6% | +38.2% | |
VanEck MSCI Multifactor EM | $594M | 0.69% | +36.8% | +91.3% | +87.8% | |
iShares MSCI EM ex-China | $495M | 0.25% | +44.4% | — | — | |
Fidelity Global EM Active | $182M | 0.99% | +27.0% | +35.1% | +23.7% | |
BetaShares MSCI EM | $41M | 0.35% | — | — | — | |
SPDR S&P EM Carbon Aware | $32M | 0.35% | +17.2% | +54.1% | +33.8% | |
JPMorgan EM Research Enhanced | $12M | 0.35% | — | — | — | |
Avantis EM Equity Active | $9M | 0.45% | — | — | — |
VGE is the default choice — the largest fund at $1.79B, backed by Vanguard, tracking the FTSE Emerging Markets index. If you want a single, simple EM allocation, this is where most investors start. At 0.48% MER it's not cheap compared to Vanguard's developed-market equivalents, but that reflects the higher cost of operating in these markets.
IEM tracks the MSCI Emerging Markets index instead of FTSE — a slightly different index with marginally different country and company weightings. The performance gap over 5 years (+38.2% vs +31.9%) partly reflects index construction differences and partly currency timing. At 0.69% it's more expensive than VGE and harder to justify as a first choice.
EMKT (VanEck's multifactor fund) is the most interesting story in this category. Over 5 years it has returned +87.8% — versus VGE's +31.9% and IEM's +38.2%. That's roughly 50 percentage points of outperformance. The fund applies factor tilts — value, momentum, and quality screens — on top of the MSCI EM universe. Factor investing has historically added alpha in EM, where markets are less efficient than in the US or Europe. Past outperformance doesn't guarantee future results, but this is a track record worth taking seriously.
EMXC deserves special attention. It tracks the MSCI Emerging Markets ex-China index — essentially EM with China removed. Over the past year it returned +44.4%, compared to VGE's +15.9%. Removing China from the index has delivered nearly 30 percentage points of extra return over one year. For investors who are bearish on China, concerned about geopolitical risk (particularly around Taiwan), or simply want to avoid the regulatory uncertainty that has clouded Chinese equities since 2021, EMXC is the cleanest solution — and at 0.25% MER it's also the cheapest broad EM option available. It only listed in June 2024, so longer-term data isn't yet available, but it has already accumulated $495M in AUM.
BEMG and WEMG are both priced at 0.35% — cheaper than VGE — and are worth watching as alternatives. WEMG (SPDR's carbon-aware version) has a 5-year return of +33.8%, slightly ahead of VGE. BEMG only listed in August 2025 so has no return history yet.
JEME (JPMorgan) and AVTE (Avantis) are the newest entries, both listed in late 2025. Both are priced at 0.35–0.45% and positioned as enhanced-index or factor-tilted strategies. Too early for any meaningful data.
FEMX is Fidelity's active EM fund — the most established active manager in this group. Over 5 years it returned +23.7%, trailing every passive alternative at a cost of 0.99%. Active management in EM has historically struggled to beat the index consistently.
For more on the active vs passive debate, see Active vs Passive ETFs: The Data That Settles the Debate.
For the top performers across all categories, see Best Performing ETFs on the ASX in 2026.
2. Asia Broad & Tech ETFs
6 funds — $3.4B AUM
ETF | Name | AUM | MER | 1Y Return | 3Y Return | 5Y Return |
|---|---|---|---|---|---|---|
iShares Asia 50 | $1,433M | 0.29% | +45.9% | +101.4% | +48.1% | |
BetaShares Asia Technology Tigers | $1,118M | 0.67% | +50.9% | +136.7% | +40.9% | |
Vanguard FTSE Asia ex-Japan | $796M | 0.40% | +28.1% | +61.7% | +37.3% | |
Platinum Asia Fund | $324M | 1.10% | +30.2% | +56.0% | +28.2% | |
Ellerston Asia Growth | $38M | 0.75% | +21.5% | — | — | |
Fidelity Asia Active | $26M | 1.16% | +16.8% | — | — | |
abrdn Sustainable Asian Opportunities | $2M | 1.18% | +24.3% | +37.3% | — |
IAA (iShares Asia 50) is the cheapest broad Asia option at just 0.29% MER. It holds the top 50 companies across China, South Korea, Taiwan, Hong Kong, and India — a concentrated, blue-chip slice of Asian equity. Over 3 years it has returned +101.4%, and at $1.43B in AUM it's the largest fund in the Asia category. For investors wanting broad Asia exposure at low cost, this is the standout choice.
ASIA (BetaShares Asia Technology Tigers) is the top performer in the group — +50.9% over 1 year and a remarkable +136.7% over 3 years. It focuses specifically on Asian technology: TSMC (the world's largest semiconductor foundry), Samsung Electronics, Tencent, Alibaba, and similar companies. These are the companies powering the global AI supply chain, and they are significantly underweighted in most broad global indices. ASIA gives concentrated, thematic exposure to that tech ecosystem. The premium — 0.67% vs IAA's 0.29% — has been well worth paying historically, though the higher concentration also means higher volatility.
The Asia tech story is about more than past returns. TSMC manufactures the most advanced chips in the world — including the chips powering AI infrastructure. Samsung dominates memory semiconductors, a critical component in every AI data centre. The global AI buildout is, in large part, an Asian semiconductor story. ASIA captures that directly.
VAE (Vanguard FTSE Asia ex-Japan) is the broadest option, covering Asia's equity markets excluding Japan. At 0.40% it sits between IAA and ASIA in cost. Over 5 years it has returned +37.3%, reflecting its more diversified, market-cap-weighted construction.
PAXX (Platinum Asia) is the only active manager in this category with a meaningful track record. Over 5 years it returned +28.2% — trailing both passive alternatives at a cost of 1.10%. Platinum has historically positioned itself as a value-oriented contrarian manager; in Asian equities, that hasn't translated to consistent outperformance versus the index.
EAFZ, FASI, and ASAO are small active funds with high fees (0.75–1.18%). None have been around long enough or delivered returns compelling enough to warrant serious consideration over the passive alternatives.
For context on thematic ETFs like ASIA, see Thematic ETFs in Australia: Defence, AI, Cybersecurity.
3. China ETFs
4 funds — $625M AUM
ETF | Name | AUM | MER | 1Y Return | 3Y Return | 5Y Return |
|---|---|---|---|---|---|---|
iShares China Large-Cap | $435M | 0.60% | -5.3% | +33.2% | -8.9% | |
VanEck China New Economy | $86M | 0.95% | +13.2% | +7.6% | +1.0% | |
Global X China Tech | $67M | 0.45% | — | — | — | |
VanEck FTSE China A50 | $37M | 0.60% | +4.1% | +12.7% | -9.4% |
China has been one of the most disappointing equity markets of the past five years. IZZ returned -8.9% over 5 years — negative total returns over a half-decade when most equity markets around the world were posting double-digit gains. CETF was even worse at -9.4% over 5 years. In the past year IZZ returned -5.3%.
The reasons are well-documented. In 2021, Beijing launched sweeping regulatory crackdowns on its own technology sector — Alibaba, Tencent, DiDi, and dozens of others faced fines, restrictions, and forced restructuring. The property sector suffered a debt crisis centred on Evergrande, which defaulted on over $300 billion in liabilities. COVID-19 lockdowns under the zero-COVID policy damaged consumer confidence and business activity well into 2023. Ongoing geopolitical tensions, particularly around Taiwan, have introduced a persistent risk premium.
CNEW (VanEck China New Economy) attempts to sidestep these issues by focusing on "new China" — technology, healthcare, consumer discretionary — rather than old-economy state-owned enterprises. Over 5 years it returned +1.0%. Better than IZZ, but barely positive, and at 0.95% MER the cost is high for that outcome.
DRGN (Global X China Tech) is the newest and cheapest China option at 0.45%. Listed in May 2025, it has no return history yet.
The comparison with EMXC says it all: EMXC returned +44.4% over the past year by simply removing China from the EM universe. IZZ returned -5.3% over the same period. The decision to exclude China was worth roughly 50 percentage points.
The bull case for China hasn't disappeared. Chinese equities trade at a significant valuation discount to global peers — price-to-earnings ratios that look compelling on paper. If the regulatory environment stabilises, if domestic consumption recovers, if geopolitical tensions ease, the rebound could be substantial. But that's been the bull case for four or five consecutive years, and the catalyst has not arrived. Investors who have waited have lost money in absolute terms.
China carries risk that is genuinely different in nature from other EM markets — specifically the risk of government policy reversals that are impossible to predict or price. That's a risk factor worth weighing carefully before allocating.
4. India ETFs
5 funds — $420M AUM
ETF | Name | AUM | MER | 1Y Return | 3Y Return | 5Y Return |
|---|---|---|---|---|---|---|
BetaShares India Quality | $194M | 0.80% | -4.8% | +16.7% | +30.2% | |
Global X India Nifty 50 | $193M | 0.69% | -6.7% | +19.9% | +41.6% | |
VanEck India Growth Leaders | $15M | 0.75% | — | — | — | |
India Avenue Equity Active | $11M | 1.10% | — | — | — | |
Fidelity India Active | $7M | 1.20% | -6.0% | — | — |
India is one of the most compelling long-term equity stories in the world — and also one of the most frustrating to own in the short term. The past year has been tough: IIND returned -4.8% and NDIA -6.7%. But zoom out and the picture is different: NDIA is up +41.6% over 5 years, IIND +30.2%.
The structural case for India is strong. It is the world's fastest-growing major economy, on course to become the third-largest economy globally within this decade. It has the youngest population of any large nation — median age under 30. The digital payments revolution (UPI), infrastructure investment, and manufacturing diversification away from China are all ongoing structural tailwinds. The Modi government's economic reform agenda, while uneven, has delivered real changes.
The recent pullback has multiple causes: stretched valuations relative to other EM markets after years of outperformance, global risk-off sentiment, and some slowing in earnings growth. Whether this represents a buying opportunity or the start of a more sustained correction depends on your view of Indian economic fundamentals and global risk appetite.
NDIA tracks the Nifty 50 — India's benchmark blue-chip index, equivalent to the S&P 500. It gives clean, low-cost exposure to the 50 largest listed Indian companies. At 0.69% it's the cheapest option with a track record.
IIND applies a quality screen on top of the Indian equity universe — filtering for profitability, balance sheet strength, and earnings stability. Over 5 years the quality tilt has cost returns vs NDIA (+30.2% vs +41.6%), though it has also reduced drawdowns in difficult periods.
GRIN (VanEck India Growth Leaders) listed in April 2025 and has no return data yet. IAEF and FIIN are active managers — at 1.10–1.20% MER they are among the most expensive ETFs in this entire universe, and FIIN's -6.0% 1-year return so far doesn't justify the premium.
India ETFs are expensive as a category. Access to India's equity market, which has relatively restricted foreign ownership rules, comes at a structural cost. The 0.69–1.20% fee range reflects that. For most investors, NDIA at 0.69% is the most sensible entry point.
5. Japan & Korea ETFs
4 funds — $1.7B AUM
ETF | Name | AUM | MER | 1Y Return | 3Y Return | 5Y Return |
|---|---|---|---|---|---|---|
iShares MSCI Japan | $1,324M | 0.50% | +23.7% | +67.9% | +62.8% | |
BetaShares Japan Hedged | $257M | 0.56% | +54.8% | +128.2% | +123.6% | |
iShares MSCI South Korea | $143M | 0.45% | +148.2% | +157.0% | +103.1% | |
Global X Japan TOPIX 100 | $9M | 0.40% | — | — | — |
Note: Japan and Korea are classified as "developed markets" by MSCI, not emerging markets. They're included in this guide because they're single-country Asia ETFs that sit outside the broad developed-market indices like VGS and BGBL, and they're typically considered alongside EM in a regional allocation context.
IKO (South Korea) has been the single best-performing ETF across this entire universe over the past year: +148.2%. Over 5 years it has returned +103.1%. Samsung Electronics, SK Hynix (one of the world's largest memory chip manufacturers), Hyundai Motor, LG Electronics, and POSCO are the core holdings. Korea benefited enormously from the global AI infrastructure buildout — SK Hynix's high-bandwidth memory (HBM) chips, which are essential for AI GPUs, became one of the most sought-after products in the semiconductor supply chain. The demand surge was reflected directly in Korean equity prices.
It's worth noting: $37M in outflows from IKO over the past period suggests some investors are taking profits after this extraordinary run.
HJPN (Japan hedged) returned +54.8% over 1 year and +123.6% over 5 years — the second strongest performer. Japanese equities have had a genuine structural revival: corporate governance reforms are pushing companies to return cash to shareholders, the Bank of Japan's policy normalisation has attracted foreign capital, and strong corporate earnings have driven re-rating. The currency hedging (removing the AUD/JPY exchange rate) added significantly to returns over this period because the yen weakened. When the yen falls, unhedged Japanese ETFs deliver less to Australian investors — HJPN removes that drag.
IJP (Japan unhedged) still returned +23.7% over 1 year and +62.8% over 5 years — strong absolute returns, but significantly less than the hedged equivalent because currency worked against investors. The hedging decision for Japan has mattered enormously. For more on when to use hedged vs unhedged, see Hedged vs Unhedged ETFs: When to Use Each.
J100 (Global X Japan TOPIX 100) listed in November 2025 and has no return history. At 0.40% it's the cheapest Japan option and tracks the TOPIX 100 — Japan's 100 largest companies. Worth watching as it builds a track record.
Performance: Huge Regional Dispersion

The single most important insight from this data: "emerging markets" is not one trade. The spread between the best performer (IKO at +148.2% over 1 year) and the worst (NDIA at -6.7%) is over 155 percentage points. Two investors with "Asian equity exposure" in their portfolios could have experienced completely different outcomes depending on which countries they held.
Here's the 1-year return picture across key funds:
Fund | Region | 1Y Return |
|---|---|---|
South Korea | +148.2% | |
Japan (hedged) | +54.8% | |
Asia Tech | +50.9% | |
Asia 50 | +45.9% | |
EM ex-China | +44.4% | |
EM Multifactor | +36.8% | |
Broad EM (MSCI) | +30.0% | |
Asia ex-Japan | +28.1% | |
Japan (unhedged) | +23.7% | |
Broad EM (FTSE) | +15.9% | |
China New Economy | +13.2% | |
China A50 | +4.1% | |
China Large-Cap | -5.3% | |
India Quality | -4.8% | |
India Nifty 50 | -6.7% |
The EM ex-China trade has been particularly noteworthy: EMXC returned +44.4% versus VGE's +15.9%. Removing China from the EM universe added nearly 30 percentage points of return over a single year — not because of any exotic strategy, but simply by avoiding a market that has been a persistent drag.
Over 5 years, the factor-tilted approach in EMKT stands out: +87.8% versus the plain-vanilla EM alternatives of +31.9% (VGE) and +38.2% (IEM). Whether you attribute that to smart factor exposure or favourable conditions for those factors, it's a substantial gap.
Fees: You Pay a Premium for Emerging Markets
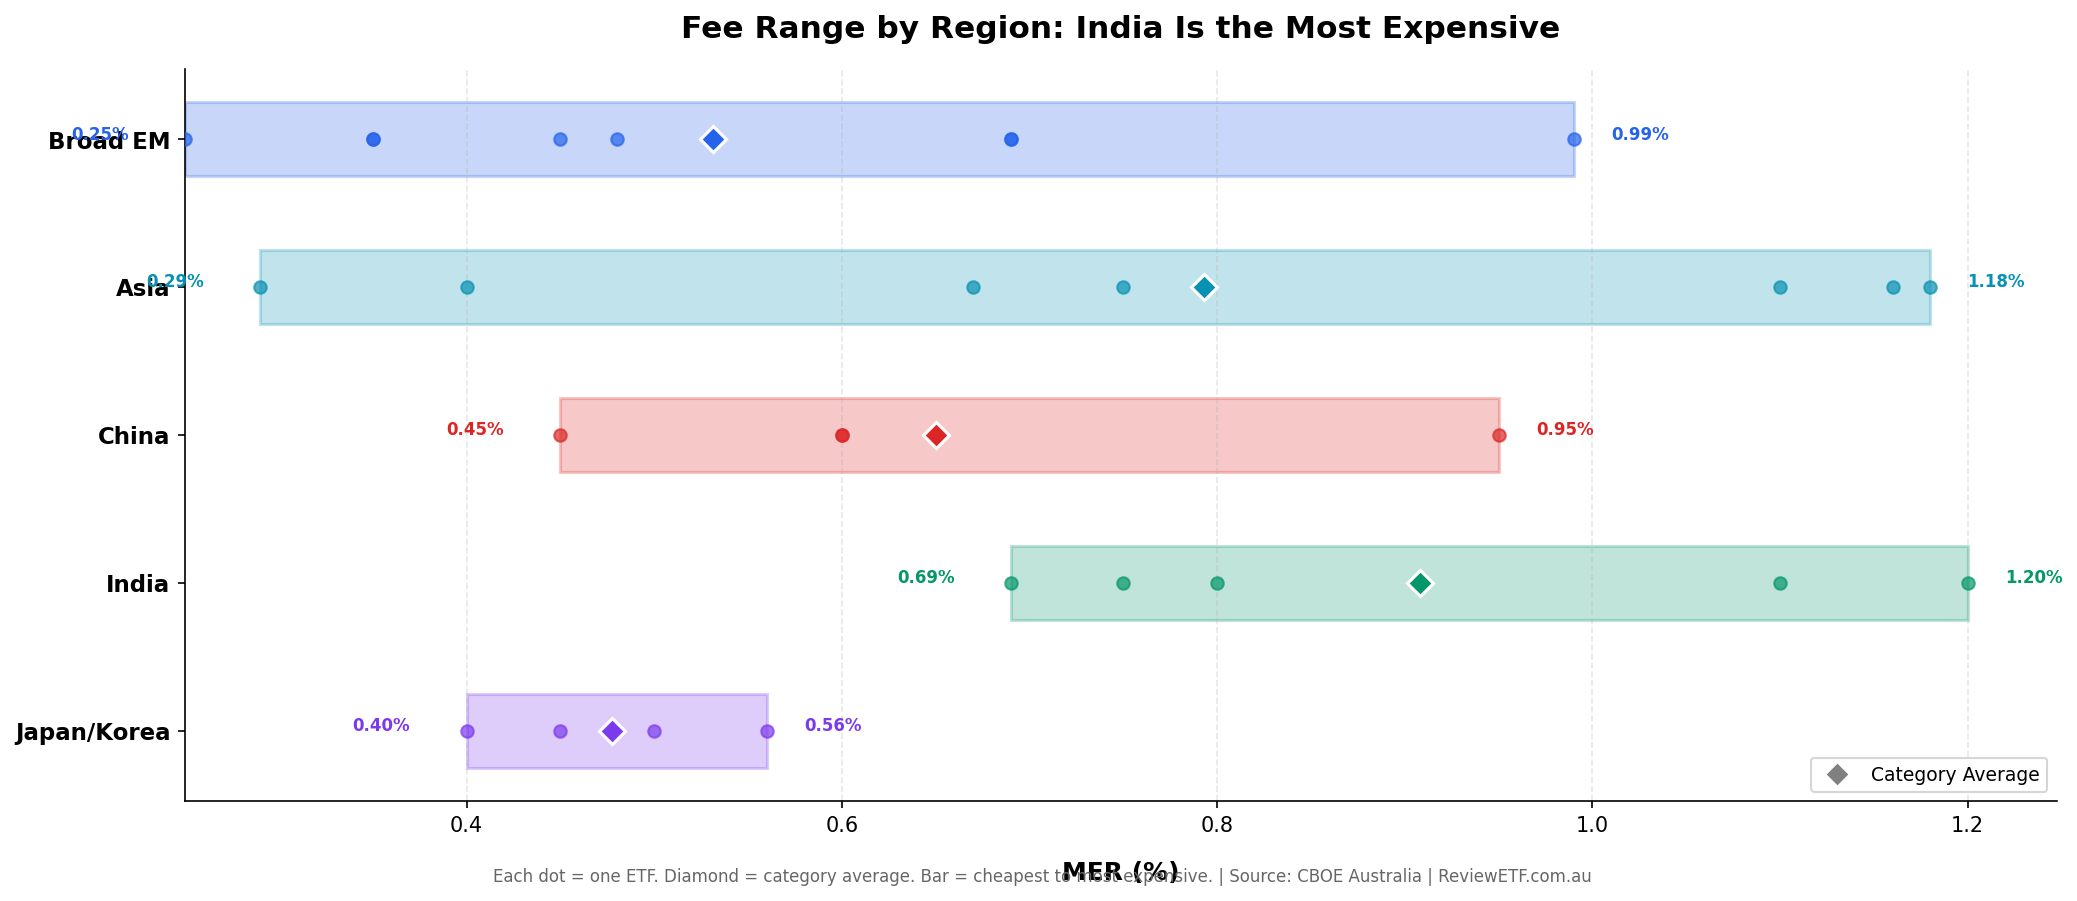
Developed market ETFs on the ASX are cheap: broad US equity for 0.03–0.07%, global shares for 0.18%. Emerging markets are structurally more expensive to operate — higher trading costs, custody costs, withholding taxes, and compliance complexity all add up.
Fund | Category | MER |
|---|---|---|
Broad EM | 0.25% | |
Asia 50 | 0.29% | |
Broad EM | 0.35% | |
Broad EM | 0.35% | |
Broad EM | 0.35% | |
Asia ex-Japan | 0.40% | |
Japan | 0.40% | |
South Korea | 0.45% | |
China Tech | 0.45% | |
Broad EM Active | 0.45% | |
Broad EM | 0.48% | |
Japan | 0.50% | |
Japan Hedged | 0.56% | |
China | 0.60% | |
China A50 | 0.60% | |
Asia Tech | 0.67% | |
Broad EM | 0.69% | |
EM Multifactor | 0.69% | |
India | 0.69% | |
Asia Active | 0.75% | |
India | 0.75% | |
India Quality | 0.80% | |
China New Economy | 0.95% | |
Broad EM Active | 0.99% | |
Asia Active | 1.10% | |
India Active | 1.10% | |
Asia Active | 1.16% | |
Asia Active | 1.18% | |
India Active | 1.20% |
A few observations:
The cheapest broad EM option is EMXC at 0.25% — cheaper than VGE (0.48%) and IEM (0.69%), and it has also outperformed both. That's a rare combination of lower cost and better outcome.
India is the most expensive category, with a floor of 0.69% and active options reaching 1.20%. Access to India's market carries a structural premium. None of the active India funds have demonstrated consistent outperformance to justify the additional cost.
Active funds as a group have not beaten passive alternatives. Looking at funds with 5-year track records: FEMX (active, 0.99%) returned +23.7% versus VGE (passive, 0.48%) at +31.9%. PAXX (active, 1.10%) returned +28.2% versus IAA (passive, 0.29%) at +48.1%. The data is consistent with the broader evidence on active vs passive management.
For the full fee comparison across all ASX ETFs, see Every ASX ETF Ranked by Fees.
Where EM Fits in Your Portfolio
The most common portfolio structure for Australian investors is built around VGS or BGBL (global developed markets) plus VAS or A200 (Australian equities). That combination is sensible — but it leaves a large gap. Emerging markets represent roughly 12–13% of global market capitalisation, and VGS/BGBL hold none of it.
Adding EM is a deliberate decision to capture the growth premium of faster-developing economies. The question is how much and which exposure.
A typical satellite allocation is 5–15% of the total portfolio in EM. Below 5% and the impact on returns is trivial. Above 15% and you're making a concentrated bet that EM outperforms, which is a credible thesis but adds meaningful volatility.
Three ways to approach it:
Broad EM via VGE or EMXC — the simplest approach. One fund, full EM exposure (or EM minus China for EMXC). VGE is the well-established default; EMXC is the newer, cheaper option that removes China risk.
Targeted Asia via IAA or ASIA — if you want Asia specifically rather than EM broadly (which includes Latin America and EMEA). IAA for diversified large-cap Asia at low cost; ASIA for concentrated tech exposure.
Country-specific via NDIA, IKO, IJP — if you have a strong conviction on a particular country's economic trajectory. Higher concentration means higher potential returns and higher volatility.
For most investors, a single EM satellite is sufficient. The difference between owning two or three EM funds versus one is mostly overlap and complexity rather than genuine diversification benefit. If you want simple: VGE or EMXC alongside your core VGS/BGBL holding covers the gap.
For more on portfolio construction approaches, see The 2-ETF Portfolio: Is It Actually the Best Approach? and Best ETFs for Australian Retirees in 2026.
Key Takeaways
VGS and BGBL hold zero emerging markets — if you want EM exposure, you need a separate allocation. It doesn't happen automatically in a developed-market portfolio.
EMXC has been the standout — +44.4% over 1 year by simply removing China from the EM index. It is also the cheapest broad EM option at 0.25% MER. That combination of lower cost and higher return is unusual and worth paying attention to.
EMKT (VanEck multifactor) has crushed broad EM over 5 years — +87.8% versus VGE's +31.9%. Factor tilts (value, momentum, quality) have delivered substantial alpha in emerging markets, where index inefficiency is higher than in developed markets.
China has been a value trap — IZZ and CETF are both down roughly -9% over 5 years. The bull case is real, but the catalyst for re-rating hasn't arrived. India has pulled back recently but delivered +42% over 5 years via NDIA.
Korea (+148% over 1 year via IKO) was the best single-country trade — driven by Samsung and SK Hynix's central role in the AI semiconductor supply chain. Past performance doesn't repeat, but the structural demand for AI infrastructure suggests the Korean semiconductor story has legs beyond a single year.
EM fees are higher than developed markets — 0.25–1.20% versus 0.04–0.18% for US/global ETFs. The cost premium is structural, but within EM the variation is wide. Paying 1.10% for an active fund that trails the 0.29% index option is a poor trade.
A 5–15% satellite allocation to EM adds genuine diversification your core portfolio lacks — not because EM always outperforms, but because the growth drivers are different, the correlation to developed markets is lower over the long run, and the countries covered represent the majority of global population and much of future GDP growth.
Start Investing in Emerging Markets
Every ETF in this guide can be purchased through any standard Australian brokerage — CommSec, Selfwealth, Pearler, Stake, or similar. Emerging markets can be volatile in the short term, but as a long-term satellite allocation they add genuine diversification that a developed-markets-only portfolio simply doesn't offer.
Explore every ETF covered in this guide in detail at ReviewETF.com.au.