Everything You Need to Know About ETF Fees and Performance

ETF fees range from 0.03% to 1.89% on the ASX. That spread matters — it's the difference between paying $3 per year or $1,890 on a $100,000 investment. But cheap doesn't always mean best, and expensive doesn't always mean worst
We analysed every ETF on the ASX — 464 funds, 214 with 5-year track records — to answer the question every investor asks: how much do fees really matter, and are you paying too much?
The Fee-Return Quadrant: 214 ETFs Mapped

We divided every ETF with a 5-year track record into four quadrants based on fee level and return:
Quadrant | Count | Description | Examples |
|---|---|---|---|
Low Fee + High Return | 58 | The sweet spot | |
Low Fee + Low Return | 50 | Cheap but disappointing | |
High Fee + High Return | 49 | Expensive but delivered | |
High Fee + Low Return | 57 | Worst of both worlds |
The sweet spot (green quadrant) is crowded with familiar names — IVV, VGS, A200, DHHF. These are the broad index funds that charge under 0.40% and have delivered strong 5-year returns. The red quadrant is dominated by leveraged/inverse products (which are more useful for taking short term positions) and underperforming active managers.
Low Fee Winners: The Best of the Best
These ETFs charge below the median fee (0.40%) and delivered the highest 5-year returns:
ETF | MER | 5Y Return | AUM | What It Does |
|---|---|---|---|---|
0.15% | +219% | $2.7B | Physical gold (Perth Mint) | |
0.04% | +107% | $12.6B | S&P 500 | |
0.35% | +115% | $1.3B | US mega-cap tech (10 stocks) | |
0.40% | +100% | $8.1B | Global quality factor | |
0.18% | +93% | $14.4B | International developed | |
0.18% | +87% | $1.3B | Ethical international | |
0.19% | +71% | $1.2B | Diversified all growth | |
0.04% | +60% | $9.8B | ASX 200 |
The pattern: broad index funds with low fees dominate this list. You don't need to pay more than 0.40% to access the best-performing ETFs on the ASX.
Low Fee Losers: Cheap But Disappointing
Not every cheap ETF delivers. These charge below-median fees but had the worst 5-year returns:
ETF | MER | 5Y Return | What Happened |
|---|---|---|---|
GGOV | 0.22% | -30% | US long-duration bonds — crushed by rate rises |
0.20% | -2.4% | Global aggregate bonds — rate rises destroyed returns | |
0.10% | +2.0% | AU bonds — barely beat cash | |
0.10% | +1.8% | AU composite bonds — same story |
The lesson: low fees don't save a bad asset class. Bond ETFs were cheap but delivered terrible returns over 5 years because interest rates rose aggressively from 2022. The fee wasn't the problem — the asset class was.
High Fee Winners: Expensive But Delivered
Some expensive ETFs justified their fees with exceptional returns:
ETF | MER | 5Y Return | What It Does |
|---|---|---|---|
0.53% | +299% | Gold miners | |
0.59% | +153% | Gold (AUD hedged) | |
0.48% | +108% | Nasdaq 100 | |
HJPN | 0.56% | +124% | Japan (hedged) |
BNKS | 0.57% | +122% | Global banks (hedged) |
These are all sector, thematic, or hedged ETFs. They charge more because they track niche indices or require currency hedging. But in the right market environment (gold boom, tech surge, Japan rally), the returns dwarfed the fee.
High Fee Losers: The Worst of Both Worlds
These ETFs charged above-median fees and still lost money:
ETF | MER | 5Y Return | What Happened |
|---|---|---|---|
1.38% | -73% | Leveraged short US equities — markets rose | |
1.38% | -65% | Leveraged short AU equities — markets rose | |
1.48% | -31% | Short AU equities | |
CLDD | 0.67% | -22% | Cloud computing — hype cycle |
IZZ | 0.60% | -9% | China large cap — geopolitics |
1.35% | +53% | Magellan — underperformed VGS by 40 points |
Leveraged and inverse ETFs dominate this list, as they are designed for taking shorter term positions. If you buy and hold an inverse ETF you are destined to lose money over time in a rising market.
But MGOC is the standout: it returned +53% over 5 years (which sounds decent) while charging 1.35%. The problem? VGS returned +93% for 0.18%. Magellan investors paid 7.5x the fee for roughly half the return.
Popular ETFs With Cheaper Alternatives

For 8 of the most popular ETFs on the ASX, there's a cheaper alternative that does the same thing:
Popular ETF | Fee | Alternative | Fee | Annual Saving on $100K |
|---|---|---|---|---|
ETHI (Ethical) | 0.59% | 0.18% | $410 | |
0.40% | 0.15% | $250 | ||
VGS (International) | 0.18% | 0.08% | $100 | |
VGAD (Hedged) | 0.21% | 0.10% | $110 | |
AAA (Cash) | 0.18% | 0.07% | $110 | |
VDHG (Diversified) | 0.27% | 0.19% | $80 | |
QUAL (Quality) | 0.40% | 0.35% | $50 | |
STW (ASX 200) | 0.05% | 0.04% | $10 |
On a $500K portfolio, switching from ETHI to VESG saves $2,050 per year.
Switching from GOLD to PMGOLD saves $1,250. These aren't trivial amounts — and the cheaper alternatives have broadly similar or better returns.
How Fees Have Changed: 2001 to 2026
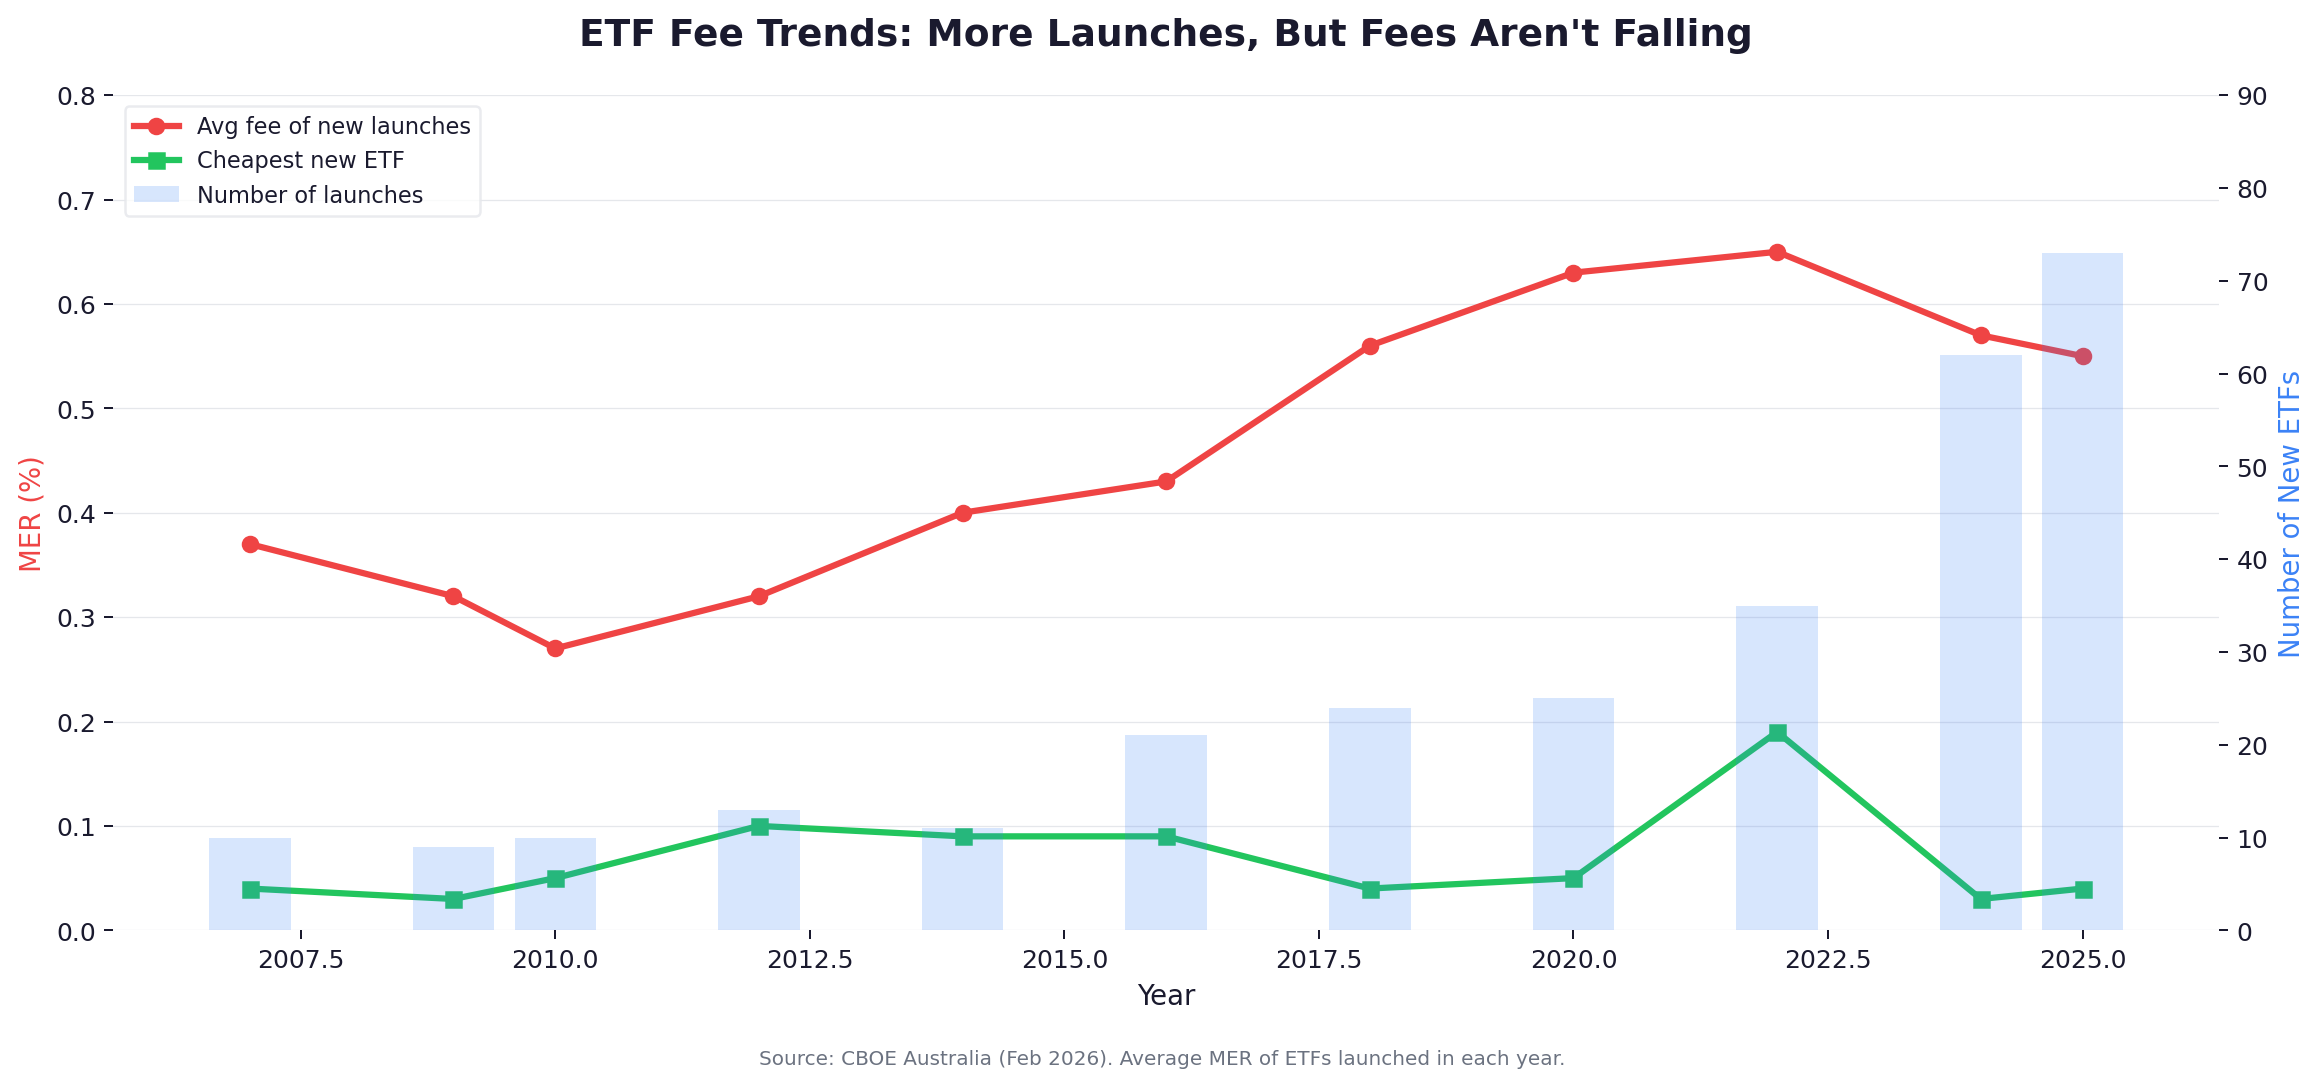
Here's the surprising finding: average fees for new ETF launches have actually increased over time, not decreased.
Era | Avg Fee of New Launches | Cheapest ETF | Launches |
|---|---|---|---|
2007–2010 | 0.32% | 0.03% (VTS) | ~30 |
2011–2015 | 0.42% | 0.07% (VAS) | ~67 |
2016–2020 | 0.55% | 0.04% (A200) | ~109 |
2021–2025 | 0.59% | 0.03% (VTS) | ~251 |
The cheapest ETFs have gotten cheaper (VTS at 0.03%, A200 at 0.04%). But the average fee of new launches has risen because the growth has been in active, thematic, and niche ETFs that charge 0.40–0.80%. The fee war is happening at the bottom — index funds are racing to zero — while the rest of the market is launching higher-fee products.
Key Fee Milestones
Year | Milestone |
|---|---|
2001 | STW launches at 0.286% — Australia's first ETF |
2009 | VAS launches at 0.14% (now 0.07%) |
2014 | VGS launches at 0.20% (now 0.18%) |
2018 | A200 launches at 0.07% (now 0.04%) — 💥fee war begins💥 |
2022 | BGBL launches at 0.08% — undercutting VGS |
2026 | VTS at 0.03% is the cheapest ETF on the ASX |
STW's fee has dropped 82% from 0.286% at launch to 0.05% today — proving that competitive pressure works. But it took 25 years and multiple competitors.
The Numbers at a Glance
Metric | Value |
|---|---|
Total ETFs on the ASX | 464 |
Average fee (all ETFs) | 0.53% |
Median fee (all ETFs) | 0.45% |
Cheapest ETF | VTS at 0.03% |
Most expensive ETF | ISLM at 1.89% |
Average fee (launched 2023–2026) | 0.56% |
Average fee (launched before 2023) | 0.51% |
ETFs in sweet spot (low fee + high return) | 58 |
ETFs in worst quadrant (high fee + low return) | 57 |
The Rules of ETF Fees
1. For broad index exposure, never pay more than 0.20%. Australian shares: 0.04–0.07%. International shares: 0.08–0.18%. S&P 500: 0.04–0.07%. Diversified: 0.19–0.27%. Anything above these ranges is overpaying for the same market exposure.
2. Thematic and sector fees are higher — that's expected. Nasdaq 100, gold, cybersecurity, and other niche exposures typically charge 0.35–0.67%. That's the cost of specialised index licensing and smaller fund sizes. The question is whether the theme delivers enough return to justify the premium.
3. Active management fees should be scrutinised hardest. MGOC charges 1.35% and underperformed VGS (0.18%) by 40 percentage points over 5 years. The burden of proof is on the active manager to deliver returns that exceed the fee gap — and most don't.
4. Check for cheaper alternatives before you buy. For nearly every popular ETF, there's a less-known fund that charges less for the same or similar exposure. PMGOLD vs GOLD. BGBL vs VGS. DHHF vs VDHG. VESG vs ETHI. A few minutes of research can save hundreds per year.
5. The cheapest ETF isn't always the best. Low fees matter most within the same category. Across categories, what you own matters more than what you pay. A cheap bond ETF underperformed an expensive gold ETF by 250 percentage points over 5 years. The fee was irrelevant — the asset class was everything.
Research every ETF mentioned in this article on ReviewETF — compare fees, performance, and holdings across all 464 ASX-listed ETFs.
Sources: CBOE Australia Monthly Funds Report (February 2026), ReviewETF.com.au. Analysis covers 464 ETFs (full universe) and 214 ETFs with 5-year track records.
No fund manager wrote this article. No issuer is paying for placement. This is independent analysis based on publicly available data.
This article is general information only and does not constitute financial advice. Consider your own circumstances and seek professional advice before making investment decisions.