
Most comparisons of Australian equity ETFs stop at three names: VAS, A200, and IOZ. That's understandable — those three funds hold roughly $42 billion in combined assets and are the default starting point for any Australian shares allocation. But they represent fewer than 4% of the options actually available on the ASX.
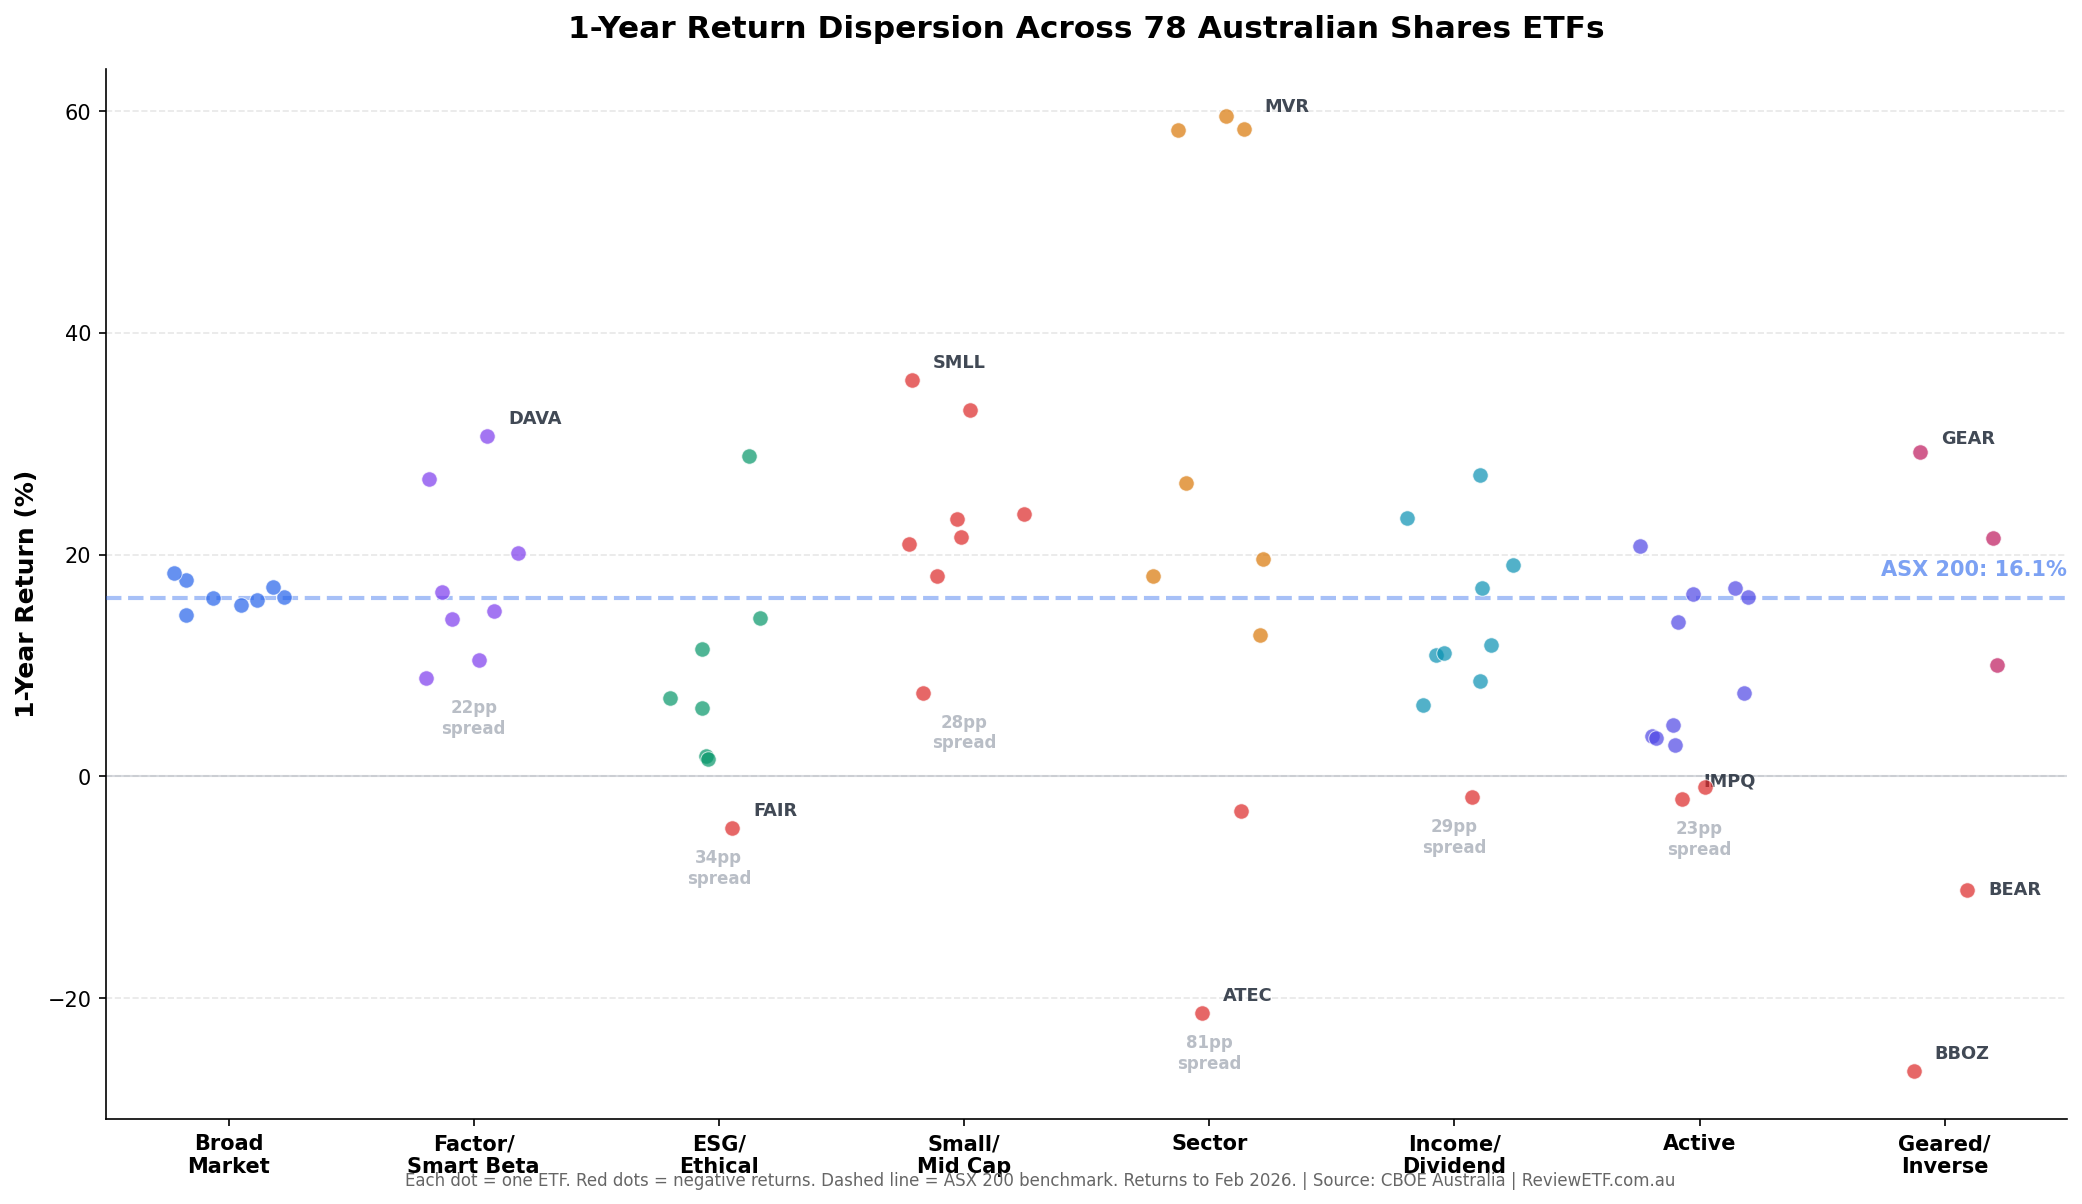
There are 78 Australian domestic equity ETFs listed on Australian exchanges as of February 2026. They range from a $24 billion passive index fund charging 0.07% per year to a $3 million hedge fund structure charging 1.31% — and everything in between. Some are straightforward index trackers. Others use screens, factors, options overlays, leverage, or short positions to deliver something different from plain market exposure.
This guide covers all 78. They're organised into three tiers: index-based ETFs that track the broad market or use systematic factor screens, sector and size ETFs that target specific parts of the Australian market, and active funds where a portfolio manager picks stocks. Each section includes a full comparison table with AUM, management expense ratio (MER), and returns across one, three, and five years.
Returns shown are cumulative total returns (including dividends reinvested) to February 2026. Where a fund has insufficient history, returns are shown as "n/a". All data sourced from CBOE Australia, February 2026.

1️⃣Part 1: Index-Based ETFs
Index-based ETFs follow a rules-based methodology — either tracking a market-cap index directly, applying a factor or smart beta screen, or filtering for ESG criteria. No active stock selection is involved.
Broad Market Index
The foundation of most Australian equity portfolios. These nine funds track the ASX 20, ASX 50, ASX 200, or ASX 300 using market-capitalisation weighting. For a plain-vanilla Australian shares allocation, one of these is almost always the right starting point.
Ticker | Name | AUM | MER | 1Y Return | 3Y Return | 5Y Return | Listed |
|---|---|---|---|---|---|---|---|
Vanguard Australian Shares Index ETF | $24.2B | 0.07% | 16.1% | 38.4% | 57.0% | May 2009 | |
Betashares Australia 200 ETF | $9.8B | 0.04% | 16.1% | 38.9% | 59.6% | May 2018 | |
iShares Core S&P/ASX 200 ETF | $8.6B | 0.05% | 15.9% | 38.4% | 58.0% | Dec 2010 | |
SPDR S&P/ASX 200 ETF | $6.7B | 0.05% | 15.5% | 38.2% | 57.4% | Aug 2001 | |
iShares S&P/ASX 20 ETF | $778M | 0.24% | 17.7% | 39.8% | 61.0% | Dec 2010 | |
SPDR S&P/ASX 50 ETF | $767M | 0.20% | 14.6% | 36.9% | 58.2% | Aug 2001 | |
Vanguard MSCI Australian Large Companies Index ETF | $329M | 0.20% | 18.3% | 40.6% | 62.1% | May 2011 | |
SPDR S&P/ASX 200 ESG ETF | $290M | 0.05% | 17.1% | 38.3% | 58.3% | Aug 2020 | |
Global X Australia 300 ETF | $13M | 0.04% | n/a | n/a | n/a | Aug 2025 |

Commentary
VAS is by far the largest Australian ETF at $24.2B in assets — nearly triple the next largest. A common misconception is that VAS tracks the ASX 200; it actually tracks the ASX 300, which includes an extra 100 smaller companies. In practice, the top 200 stocks account for about 97% of the fund's weight, so the difference in day-to-day performance is negligible.
A200 and A300 tie for the lowest fee at 0.04%, making them the cost leader for passive Australian exposure. A200 tracks the ASX 200 and has $9.8B in assets. A300 launched in August 2025 — it matches A200's fee but extends coverage to 300 stocks. No meaningful performance history is available yet for A300.
The performance difference between the big four (VAS, A200, IOZ, STW) is minimal. Over five years, the spread is less than 2.3 percentage points in cumulative terms — barely meaningful after accounting for tracking differences and distribution timing. Any of the four would serve an investor well.
ILC and SFY offer narrower cuts — the ASX 20 and ASX 50 respectively. Both are dominated by the big banks and miners. ILC has slightly outperformed the ASX 200 equivalents over five years (61.0% vs ~57-59%) because the very largest stocks have led the market. Both carry higher MERs than A200/IOZ despite simpler portfolios.
VLC tracks the MSCI Australia Large Cap index and has been the best performer in this group over five years at 62.1%. Like ILC, its mega-cap tilt has benefited from large-cap leadership.
E200 is the notable outlier here: it applies an ESG screen to the ASX 200 but charges just 0.05% — in line with the plain-vanilla IOZ and STW. It's also covered in the ESG section below. At 0.05% with an ESG overlay, it arguably represents the best-value ethical option among all Australian ETFs.
Factor & Smart Beta
Factor ETFs don't simply hold the market. They tilt toward stocks with specific characteristics — value, quality, momentum, low volatility, or some combination. Results have diverged sharply: value and quality strategies have outperformed the broad market since 2022, while low-volatility and managed-risk approaches have lagged.
Ticker | Name | AUM | MER | 1Y Return | 3Y Return | 5Y Return | Listed |
|---|---|---|---|---|---|---|---|
VanEck Australian Equal Weight ETF | $3.3B | 0.35% | 8.9% | 27.6% | 50.1% | Mar 2014 | |
Dimensional Australian Value Trust | $1.5B | 0.34% | 30.7% | n/a | n/a | Aug 2024 | |
Betashares FTSE RAFI Australia 200 ETF | $1.1B | 0.40% | 26.8% | 50.3% | 72.9% | Jul 2013 | |
Betashares Australian Quality ETF | $1.0B | 0.35% | 16.7% | 58.1% | n/a | Apr 2022 | |
Betashares Australian Momentum ETF | $198M | 0.35% | 14.1% | n/a | n/a | Jul 2024 | |
iShares Edge MSCI Australia Multifactor ETF | $151M | 0.30% | 20.1% | 46.9% | 60.5% | Oct 2016 | |
iShares Edge MSCI Australia Minimum Volatility ETF | $30M | 0.30% | 14.9% | 36.1% | 57.7% | Oct 2016 | |
Betashares Managed Risk Australian Shares ETF | $34M | 0.49% | 10.5% | 24.7% | 32.2% | Nov 2015 | |
Global X S&P Australia GARP ETF | $2M | 0.25% | n/a | n/a | n/a | Oct 2025 |
Commentary
The standout story in factor investing over the past year has been value. DAVA (Dimensional's systematic value tilt) returned 30.7% in the year to February 2026, almost doubling the broad market's 16%. QOZ (FTSE RAFI, a fundamentals-weighted value approach) returned 26.8% over the same period and 72.9% cumulatively over five years — the best five-year number in this group. Both suggest that the deep-value tilt in Australian shares has been rewarded as banks and resource companies dominated.
AQLT applies a quality screen (return on equity, earnings stability, low leverage) to ASX stocks. Its 3-year cumulative return of 58.1% is the highest in this group — compare that to the plain ASX 200's ~38%. Quality appears to have been the winning factor over a three-year horizon.
MVW is the equal-weight approach: it holds ~100 ASX stocks with roughly equal allocation, removing the market's heavy tilt toward the big four banks and top miners. With $3.3B in assets it's by far the largest factor ETF in Australia. Over one year it underperformed significantly (8.9% vs ~16% for the ASX 200) as the mega-caps led. Over five years it's tracked the index broadly (50.1%). Equal weight tends to outperform in broad rallies driven by mid-cap companies, and underperform when market heavyweights lead.
AUMF combines value, quality, momentum, and size factors into a single multifactor portfolio. Its 1Y return of 20.1% and 5Y of 60.5% both beat the ASX 200 equivalents. At 0.30% it's reasonably priced for a diversified factor approach.
MTUM is Betashares' momentum ETF, launched July 2024. It holds the ASX stocks with the strongest recent price momentum. With only seven months of history to February 2026, no meaningful assessment is possible yet.
MVOL targets Australian stocks with the lowest historical volatility. It has largely tracked the broad market over five years (57.7% vs ~58% for the ASX 200) — the low-volatility premium in Australian equities has been modest. In sharp contrast, AUST — which uses derivatives to manage downside risk — returned only 32.2% over five years, significantly underperforming the market. The cost of downside protection in a rising market has been high.
GRPA (Growth at a Reasonable Price) launched in October 2025 and has no meaningful return history yet. At 0.25% it is the cheapest fund in this category.
ESG & Ethical
Eight funds apply environmental, social, and governance screens to Australian equities. They vary substantially in methodology — from simple exclusions (weapons, tobacco, fossil fuels) to full ESG integration with positive screening. Performance has diverged, with the cheapest funds broadly tracking the market and the more selective ethical funds lagging meaningfully.
Note: E200 appears in both this section and the Broad Market Index table above, as it is simultaneously the cheapest ESG option (0.05%) and a credible substitute for plain-vanilla ASX 200 exposure.
Ticker | Name | AUM | MER | 1Y Return | 3Y Return | 5Y Return | Listed |
|---|---|---|---|---|---|---|---|
SPDR S&P/ASX 200 ESG ETF | $290M | 0.05% | 17.1% | 38.3% | 58.3% | Aug 2020 | |
Vanguard Ethically Conscious Australian Shares ETF | $661M | 0.16% | 14.3% | 40.5% | 55.9% | Oct 2020 | |
iShares Core MSCI Australia ESG ETF | $455M | 0.09% | 7.1% | 33.6% | n/a | Jun 2021 | |
iShares S&P/ASX Dividend Opportunities ESG Screened ETF | $390M | 0.23% | 28.9% | 50.9% | 64.5% | Dec 2010 | |
Russell Investments Australian Responsible Investment ETF | $470M | 0.45% | 11.5% | 37.2% | 56.3% | Apr 2015 | |
VanEck MSCI Australian Sustainable Equity ETF | $250M | 0.35% | 6.2% | 33.3% | 50.2% | May 2016 | |
Betashares Australian Sustainability Leaders ETF | $1.2B | 0.49% | -4.7% | 17.3% | 26.3% | Nov 2017 | |
Perpetual ESG Australian Share Active ETF | $14M | 0.65% | 1.9% | 22.7% | n/a | Nov 2021 | |
Australian Ethical High Conviction Fund | $11M | 0.69% | 1.6% | 17.9% | n/a | Feb 2022 |
Commentary
The gap between cheap ESG and expensive ESG is wide — and so is the performance gap.
E200 at 0.05% is the standout. It applies a light ESG screen to the ASX 200 and charges the same as a plain-vanilla index fund. Its 5-year return of 58.3% virtually matches IOZ (58.0%) and STW (57.4%). For investors who want basic ESG compliance without sacrificing performance or paying a premium, E200 is hard to argue against.
IESG is the second cheapest at 0.09% and applies iShares' MSCI ESG screening methodology. Its 1-year return of 7.1% underperformed the broad market significantly — suggesting its ESG screen has skewed the portfolio away from the resource and bank stocks that drove the market higher in 2025-2026.
IHD has the best returns across all time periods shown here: 28.9% over 1 year, 50.9% over 3 years, 64.5% over 5 years. This is because IHD combines an ESG screen with a dividend yield focus — it holds high-dividend, ESG-compliant companies. As banks and income-generating stocks rallied strongly, IHD benefited. Note that IHD is also reviewed in depth in our Australian Dividend ETF comparison.
FAIR is the largest ESG ETF at $1.2B and the worst performer. Its -4.7% return over 1 year is a stark contrast to the market's +16%. FAIR applies strict negative screening — excluding fossil fuels, gambling, weapons, and many resource companies — which means it missed the resources rally almost entirely. Over five years its 26.3% cumulative return is less than half the market's 57-59%. Investors in FAIR have paid a heavy price for its ethical stance in a market period dominated by the sectors it excludes.
VETH and RARI sit in the middle ground: both broadly track the ASX with exclusions, and their 5-year returns (55.9% and 56.3%) are close to the broad market. RARI charges 0.45% vs VETH's 0.16% — an argument for VETH if the methodologies are acceptable to the investor.
GIVE and AEAE are active ESG funds with the highest fees in this category (0.65% and 0.69%). Both have returned less than 2% over 1 year. Small AUM suggests limited institutional uptake.
2️⃣Part 2: Sector & Size ETFs
Small & Mid Cap
Nine funds cover Australian small and mid-cap stocks — the ~200 to ~2000 market-cap range below the ASX Top 20. Small-cap returns have been strong over the past year, with the best-performing funds delivering more than double the broad market's return. The passive default is VSO (Vanguard), but active managers have made a strong case for themselves here.
Ticker | Name | AUM | MER | 1Y Return | 3Y Return | 5Y Return | Listed |
|---|---|---|---|---|---|---|---|
Vanguard MSCI Australian Small Companies Index ETF | $1.2B | 0.30% | 23.7% | 39.7% | 47.5% | May 2011 | |
Firetrail Australian Small Companies Fund | $532M | 0.85% | 33.1% | n/a | n/a | Nov 2024 | |
VanEck S&P/ASX MidCap ETF | $495M | 0.45% | 18.1% | 36.9% | 60.0% | Oct 2013 | |
Betashares Australian Small Companies Select ETF | $340M | 0.39% | 35.7% | 47.1% | 45.7% | Apr 2017 | |
VanEck Small Companies Masters ETF | $221M | 0.49% | 23.2% | 36.9% | 36.8% | May 2015 | |
iShares S&P/ASX Small Ordinaries ETF | $193M | 0.55% | 21.6% | 37.2% | 27.5% | Dec 2010 | |
SPDR S&P/ASX Small Ordinaries ETF | $30M | 0.50% | 21.0% | 38.0% | 26.4% | Apr 2011 | |
Paradice Australian Mid Cap Fund | $73M | 0.90% | n/a | n/a | n/a | Nov 2025 | |
K2 Australian Small Cap Hedge Fund | $10M | 1.31% | 7.6% | 4.9% | -0.5% | Dec 2015 |
Commentary
Small caps have outperformed large caps meaningfully over the past year. VSO, the passive benchmark, returned 23.7% — well ahead of the ASX 200's ~16%. Active managers have amplified this further.
SMLL (Betashares Select) is the standout at 35.7% over 1 year — the best one-year return of any small-cap fund here. SMLL uses a systematic screen within the small-cap universe, selecting higher-quality names. Its 3-year return of 47.1% also tops the group. At 0.39% it is the second cheapest in this category after VSO.
FSML (Firetrail) is an actively managed small-cap fund that listed in November 2024. Its 1-year return of 33.1% is exceptional for a fund with only one year of ETF history, though note that a brief period does not establish a track record. At $532M in AUM after just over a year, it has attracted significant investor interest.
VSO remains the passive default — lowest cost in the category (0.30%) after nearly 15 years of operation. If you want broad small-cap exposure without paying for active management, VSO is the starting point.
MVE provides mid-cap exposure specifically (ASX 50–200 range) rather than small-cap. Its 5-year return of 60.0% is the highest in this group, suggesting the mid-cap segment has been particularly rewarding over the medium term.
KSM is a long/short hedge fund structure and has delivered poor results: negative over five years (-0.5%) and barely positive over three years (4.9%). At 1.31% it is also the most expensive in this category. Its $10M AUM reflects limited investor confidence.
M1DS (Paradice Mid Cap) launched in November 2025 and has no reported return history yet.
Sector — Resources & Mining
Three ETFs provide concentrated exposure to Australian resources and mining companies. A fourth — OZXX — takes the inverse approach, targeting companies outside the resources and financials sectors.
The resources story over the past year has been extraordinary. All three major funds returned approximately 58-60% in the year to February 2026 — driven by iron ore prices, gold, and the performance of BHP, Rio Tinto, and Fortescue.
Ticker | Name | AUM | MER | 1Y Return | 3Y Return | 5Y Return | Listed |
|---|---|---|---|---|---|---|---|
VanEck Australian Resources ETF | $655M | 0.35% | 58.4% | 47.1% | 87.6% | Oct 2013 | |
Betashares Australian Resources Sector ETF | $481M | 0.34% | 59.5% | 46.8% | 70.1% | Dec 2010 | |
SPDR S&P/ASX 200 Resources ETF | $265M | 0.34% | 58.3% | 45.0% | 68.2% | Apr 2011 | |
Global X Australia Ex-Financials & Resources ETF | $7M | 0.25% | -3.2% | n/a | n/a | Apr 2023 |
Commentary
The three major resources ETFs are nearly interchangeable in terms of performance — a spread of just 1.2 percentage points in 1-year returns despite slightly different index methodologies. MVR is the largest at $655M and has the best 5-year return (87.6%) thanks to broader exposure that extends beyond the S&P/ASX 200 to include some additional small-cap resource names. QRE and OZR are both priced at 0.34%.
The one-year returns of ~58-60% put resources firmly as the best-performing sector in Australian equities over this period — more than three times the broad market return. This kind of outperformance inevitably invites caution: resources are notoriously cyclical, and past commodity price strength is not predictive of future returns.
OZXX effectively excludes the two largest sectors (financials and resources) from the ASX 200, holding the remainder. Its -3.2% return over 1 year reflects that those excluded sectors drove the market: if you took out banks and miners in 2025-2026, Australian equities went backwards.
Sector — Financials
Australian financials are dominated by the Big Four banks (CBA, NAB, WBC, ANZ), which collectively make up around 20% of the ASX 200. Three ETFs isolate this sector, though each has a slightly different scope.
Ticker | Name | AUM | MER | 1Y Return | 3Y Return | 5Y Return | Listed |
|---|---|---|---|---|---|---|---|
VanEck Australian Banks ETF | $304M | 0.28% | 26.4% | 73.2% | 102.9% | Oct 2013 | |
Betashares Australian Financials Sector ETF | $76M | 0.34% | 19.6% | 71.9% | 99.2% | Dec 2010 | |
SPDR S&P/ASX 200 Financials Ex A-REIT ETF | $50M | 0.34% | 18.1% | 68.5% | 94.6% | Apr 2011 |
Commentary
The Australian banking sector has been a remarkable performer. MVB has returned 102.9% over five years — the fund has more than doubled. The 3-year return of 73.2% is the highest of any sector ETF in this guide. Australian banks benefited from a rising rate environment, strong mortgage book profitability, and growing investor preference for yield-generating assets.
The key distinction: MVB holds only banks — its concentrated focus is why it has outperformed QFN and OZF over the bank rally period. QFN includes other financials (insurers, diversified financials) which diluted returns. OZF covers the S&P/ASX 200 Financials sector excluding REITs.
At 0.28%, MVB is also the cheapest of the three. For an investor who specifically wants bank exposure, MVB is the clear choice.
Sector — Technology
A single ETF covers the Australian technology sector directly.
Ticker | Name | AUM | MER | 1Y Return | 3Y Return | 5Y Return | Listed |
|---|---|---|---|---|---|---|---|
Betashares S&P/ASX Australian Technology ETF | $486M | 0.48% | -21.4% | 32.9% | 10.2% | Mar 2020 |
Commentary
ATEC tracks the S&P/ASX All Technology Index. Its -21.4% return over 1 year is the worst among all non-inverse, non-leveraged Australian equity ETFs in this guide. This needs context: the ASX technology sector bears little resemblance to the Nasdaq. It is dominated by buy-now-pay-later companies (Afterpay, ZIP), software companies (WiseTech, TechnologyOne, REA Group), and payment processors — many of which were extreme beneficiaries of the 2020-2021 low-rate environment and have retraced sharply as interest rates remained elevated.
The contrast with global tech performance is stark. While the Nasdaq has continued making all-time highs, Australian tech has given back most of its post-COVID gains. Over five years, ATEC has returned just 10.2% cumulatively — a fraction of the broad market.
For investors who want technology exposure, global technology ETFs listed on the ASX (e.g., NDQ, FANG, TECH) have delivered dramatically different outcomes from ATEC, reflecting the different composition of the domestic versus global tech universe.
Sector — Ex-Top 20
Two ETFs target Australian companies outside the ASX Top 20, providing portfolio diversification away from the bank-and-miner concentration that dominates the large-cap index.
Ticker | Name | AUM | MER | 1Y Return | 3Y Return | 5Y Return | Listed |
|---|---|---|---|---|---|---|---|
Betashares Australian Ex-20 Portfolio Diversifier ETF | $647M | 0.25% | 12.7% | 32.3% | 45.1% | Oct 2016 | |
First Sentier Ex-20 Australian Share Active ETF | $104M | 0.75% | n/a | n/a | n/a | Dec 2025 |
Commentary
EX20 holds the ASX 200 but excludes the top 20 companies — effectively shifting weight away from the Big Four banks, BHP, Rio Tinto, and CSL. It's commonly used alongside a core broad-market ETF to tilt a portfolio toward mid-cap and non-resource/bank exposure. Its 5-year return of 45.1% lags the ASX 200's ~57-59%, as the top 20 companies have been the strongest performers over this period.
XX20 (First Sentier, active) launched in December 2025 and has no reported return history yet. At 0.75% it charges a significant premium over EX20's 0.25%.
3️⃣Part 3: Income & Yield ETFs
Dividend & Income
Twelve ETFs focus primarily on delivering income from Australian equities through dividends. They range from straightforward passive high-yield indexes to actively managed dividend strategies, and one (IHD) combines dividend focus with ESG screening.
Related reading: We've published a detailed comparison of Australian dividend ETFs — see our blog: Australia's Dividend ETFs Compared. The table below covers all 12 for completeness; detailed analysis is in that dedicated post.
Ticker | Name | AUM | MER | 1Y Return | 3Y Return | 5Y Return | Listed |
|---|---|---|---|---|---|---|---|
Vanguard Australian Shares High Yield ETF | $7.0B | 0.25% | 23.3% | 45.5% | 72.7% | May 2011 | |
iShares S&P/ASX Dividend Opportunities ESG Screened ETF | $390M | 0.23% | 28.9% | 50.9% | 64.5% | Dec 2010 | |
SPDR MSCI Australia Select High Dividend Yield ETF | $626M | 0.20% | 19.0% | 34.9% | 54.3% | Sep 2010 | |
Russell Investments High Dividend Australian Shares ETF | $335M | 0.34% | 17.0% | 38.5% | 55.9% | May 2010 | |
Betashares Australian Dividend Harvester Active ETF | $295M | 0.72% | 11.0% | 30.2% | 36.6% | Nov 2014 | |
Global X S&P/ASX 200 High Dividend ETF | $94M | 0.24% | 27.2% | 42.1% | 42.9% | Jun 2015 | |
Switzer Dividend Growth Fund | $59M | 0.89% | 11.9% | 20.1% | 36.3% | Feb 2017 | |
VanEck Morningstar Australian Moat Income ETF | $33M | 0.35% | -1.9% | 13.2% | 30.4% | Sep 2020 | |
Perennial Income Generator Active ETF | $29M | 0.80% | 11.1% | 23.9% | 43.8% | May 2018 | |
Ausbil Active Dividend Income Fund | $592M | 0.85% | n/a | n/a | n/a | Sep 2025 | |
Betashares S&P Australian Shares High Yield ETF | $75M | 0.25% | n/a | n/a | n/a | Aug 2025 | |
Investors Mutual Equity Income Fund | $22M | 0.90% | n/a | n/a | n/a | Sep 2025 |
Commentary
VHY is the flagship Australian dividend ETF at $7.0B in assets. Its 5-year return of 72.7% substantially exceeds the broad market (~57-59%), reflecting that high-dividend stocks (primarily banks and resource companies) have outperformed the market over this period. At 0.25% it is the most cost-effective of the major dividend funds.
SYI (SPDR MSCI Australia Select High Dividend Yield) is a peer of VHY using the MSCI methodology. At 0.20% it is actually slightly cheaper than VHY, and with $626M in assets it is well-established. Its 5-year return (54.3%) has lagged VHY, suggesting the MSCI dividend screen selects differently.
IHD leads on 1-year (28.9%) and 3-year (50.9%) returns, combining dividend orientation with ESG screening. See the ESG section for further detail.
ZYAU had a standout 1-year return of 27.2%, suggesting its selection methodology captured the bank and yield stock rally effectively.
DVDY (VanEck Moat Income) uses Morningstar's economic moat framework to select stocks. Its -1.9% return over 1 year and 30.4% over 5 years significantly underperforms most peers in this category. The moat-focused approach has not aligned well with the yield-driven rally.
DIVI, HYLD, and EQIN all launched in mid-to-late 2025 and have no available return history.
Covered Call & Yield Maximiser
Two ETFs use options strategies to generate enhanced income distributions by systematically writing (selling) call options over their holdings.
Ticker | Name | AUM | MER | 1Y Return | 3Y Return | 5Y Return | Listed |
|---|---|---|---|---|---|---|---|
Betashares Australian Top 20 Equity Yield Maximiser ETF | $668M | 0.76% | 8.6% | 26.3% | 43.5% | Nov 2012 | |
Global X S&P/ASX 200 Covered Call ETF | $94M | 0.60% | 6.4% | 30.3% | n/a | Feb 2023 |
Commentary
Covered call ETFs work by holding an underlying portfolio of Australian shares and writing call options against those positions. The premium collected from selling options boosts the income distribution — these funds typically distribute significantly more than conventional equity ETFs. The trade-off is that the option writing caps upside: when the market rises sharply, the fund's gains are limited by the strike prices of the written options.
YMAX holds the ASX Top 20 and has been running since 2012. Its 1-year total return of 8.6% substantially underperformed the ASX 200's 16% — the cost of having upside capped in a rising market is evident. Over five years its 43.5% total return also lags the market significantly. Investors in YMAX are primarily seeking income, not total return, and in that context the distributions (not visible in the total return numbers shown here) are the primary metric.
AYLD is a newer Global X fund covering the ASX 200. At 0.60% it is cheaper than YMAX's 0.76%.
These are complex products not suitable for growth-oriented investors. The strategic use case is for investors in, or approaching, the income-drawdown phase who prioritise regular cash distributions over capital appreciation.
4️⃣Part 4: Active & Managed Funds
Active Australian Equity
Fifteen funds where a portfolio manager (or team) makes discretionary or systematic-but-active stock selection decisions. Combined assets in this category exceed $11 billion — a substantial vote of confidence in active management despite the well-documented challenges of outperforming passive indices after fees.
Ticker | Name | AUM | MER | 1Y Return | 3Y Return | 5Y Return | Listed |
|---|---|---|---|---|---|---|---|
Dimensional Australian Core Equity Trust | $6.8B | 0.28% | 20.8% | n/a | n/a | Nov 2023 | |
Macquarie Core Australian Equity Active ETF | $1.0B | 0.03% | 16.2% | n/a | n/a | May 2024 | |
Airlie Australian Share Fund | $1.0B | 0.78% | 4.6% | 24.6% | 54.9% | Jun 2020 | |
AB Managed Volatility Equities Fund | $836M | 0.55% | 2.8% | 19.7% | n/a | Apr 2021 | |
VanEck Australian Long Short ETF | $26M | 0.39% | 17.0% | n/a | n/a | Jan 2025 | |
Milford Australian Absolute Growth ETF | $22M | 1.05% | 13.9% | 20.7% | n/a | Jan 2023 | |
Intelligent Investor Equity Growth Fund | $89M | 0.97% | 7.6% | 14.1% | 34.4% | Oct 2020 | |
Intelligent Investor Australian Equity Income Fund | $73M | 0.97% | 16.4% | 18.1% | 43.6% | Jun 2018 | |
Intelligent Investor Ethical Share Fund | $68M | 0.97% | -1.0% | 18.8% | 23.7% | Jun 2019 | |
Perennial Better Future Active ETF | $36M | 0.99% | -2.0% | 2.8% | -1.5% | May 2019 | |
IML Concentrated Australian Share Fund | $3M | 0.99% | 3.7% | n/a | n/a | Aug 2023 | |
Fidelity Australian High Conviction Active ETF | $2M | 0.85% | 3.5% | n/a | n/a | Jun 2024 | |
Ten Cap Alpha Plus ETF | $5M | 0.97% | n/a | n/a | n/a | Nov 2025 |
Commentary
The active category is dominated by two standouts at opposite ends of the philosophy spectrum.
DACE (Dimensional Australian Core Equity) has accumulated $6.8B in AUM since listing in November 2023 — a remarkable pace of growth. Dimensional's approach is systematic and factor-based (tilting toward value and profitability) rather than traditional stock-picking. Its 1-year return of 20.8% exceeded the ASX 200's 16.1%, suggesting the factor tilts have added value in the recent market. At 0.28% it is inexpensive for an active fund.
MQAE (Macquarie Core) is technically the cheapest ETF on the entire ASX at 0.03% — cheaper than A200 and A300 (both 0.04%). Macquarie is effectively offering active management at a passive price point, which explains its rapid $1B+ AUM accumulation since launching in May 2024. Its 1-year return of 16.2% is essentially in line with the broad index. At 0.03%, even marginal outperformance translates to value over time.
AASF (Airlie) is one of Australia's best-known value-oriented active managers in ETF wrapper form. With $1.0B in AUM it has strong institutional credibility. However, its 1-year return of 4.6% has significantly underperformed the market. Its 5-year return of 54.9% is slightly below the broad market's 57-59% — challenging the active management premium at 0.78%.
AMVE (AB Managed Volatility) targets lower portfolio volatility through active construction. Its returns (2.8% over 1Y, 19.7% over 3Y) have lagged the market, which is expected if volatility management was working as intended — the question is whether the reduced volatility was worth the return drag.
ALFA (VanEck Australian Long Short) takes both long and short positions in Australian equities. Its 17.0% 1-year return is competitive with the market, though with only one year of history since January 2025 it's too early to evaluate the long/short strategy's value.
MFOA (Milford Australian Absolute Growth) is a New Zealand-based manager with an Australian absolute return mandate. At 1.05% it is the most expensive broadly-active fund here. Its 1-year return of 13.9% and 3-year of 20.7% both underperform the index after fees.
The Intelligent Investor suite (IIGF, INIF, INES) offers three actively managed portfolios at 0.97% each. None has a compelling return track record relative to the broad index. IMPQ (Perennial Better Future) is notable for its negative 5-year return (-1.5% cumulatively) at 0.99% — a fund that has delivered less than zero while charging close to 1% per year.
TCAP, IMLC, and FHCO are all small, newer funds with limited history. None has demonstrated performance that would justify fees of 0.85-0.99% versus the passive alternatives.
5️⃣Part 5: Geared & Inverse
Geared & Inverse
Seven complex ETFs use leverage or short positions to magnify or invert Australian market returns. These are specialist products with specific use cases — primarily short-term tactical trading or hedging. They are not appropriate for long-term, buy-and-hold investors.
Warning: Geared and inverse ETFs are complex financial products. Leveraged funds can lose more than 50% in a market decline. Inverse funds decay in value over time due to daily rebalancing, meaning they do not provide a perfect hedge over longer periods. Read the relevant product disclosure statement (PDS) carefully before investing.
Ticker | Name | AUM | MER | 1Y Return | 3Y Return | 5Y Return | Listed |
|---|---|---|---|---|---|---|---|
Betashares Geared Australian Equities ETF | $563M | 0.80% | 29.3% | 66.3% | 103.8% | May 2014 | |
Betashares Australian Equities Strong Bear ETF | $190M | 1.38% | -26.6% | -42.9% | -64.6% | Apr 2015 | |
First Sentier Geared Australian Share ETF | $132M | 0.95% | n/a | n/a | n/a | May 2025 | |
VanEck Geared Australian Equal Weight ETF | $40M | 0.35% | 10.0% | n/a | n/a | Feb 2024 | |
Betashares WealthBuilder Global Geared ETF | $39M | 0.35% | n/a | n/a | n/a | Sep 2025 | |
Betashares WealthBuilder Australia 200 Geared ETF | $29M | 0.35% | 21.5% | n/a | n/a | Apr 2024 | |
Betashares Australian Equities Bear ETF | $33M | 1.48% | -10.3% | -16.1% | -30.7% | Jul 2012 |
Commentary
Geared ETFs amplify market returns — both up and down. GEAR has returned 103.8% over five years in a broadly rising market, more than doubling the unlevered ASX 200 return. That figure will look very different in a sustained downturn — a 30% market fall can produce a 60%+ loss in a 2x leveraged product.
GEAR targets approximately 2x leverage on the ASX 200. Its $563M in AUM makes it the largest product in this category. G200 and GGBL are newer "WealthBuilder" funds from Betashares that use a different structure (internal leverage through a wholesale fund) to achieve similar outcomes at a lower MER (0.35%). LEVR (First Sentier, launched May 2025) has no return history yet.
GMVW provides geared exposure to the equal-weight index (the underlying is similar to MVW). Its 1-year return of 10.0% lags G200's 21.5%, consistent with equal-weight's underperformance of the cap-weighted index in a large-cap-led market.
BEAR and BBOZ are inverse funds — they profit when the market falls. BEAR targets -1x daily returns; BBOZ targets -2x to -2.75x. In a rising market they are money-losing instruments by design. BEAR charges 1.48% — the highest MER of any fund in this entire guide. BBOZ has lost 64.6% cumulatively over five years as the market trended upward. These are hedging tools for sophisticated investors with specific short-term views, not investment products.
Key Takeaways

The big three are nearly interchangeable. VAS, A200, and IOZ all returned within 0.7 percentage points of each other over 1 year (15.5%–16.1%) and within 2.2 points over 5 years (57.0%–59.6%). Choose based on fee (A200 wins at 0.04%) or existing broker/platform relationship. E200 is a credible ESG alternative at the same 0.05% fee as IOZ.
Fee range spans 50x. MQAE charges 0.03%; BEAR charges 1.48%. That 50-fold difference in fees is not remotely justified by performance in either case — MQAE tracks the broad market, and BEAR has lost money for five straight years in a rising market. The cheapest broadly diversified active ETF (MQAE, 0.03%) is now cheaper than the most popular passive ETF (VAS, 0.07%).
Resources were the standout sector. MVR, QRE, and OZR all returned approximately 58-60% in 1 year — more than three times the broad market. MVB (banks) returned 102.9% over 5 years, demonstrating the dominance of financials and resources in determining Australian equity outcomes.
Factor ETFs have diverged sharply. DAVA (value) returned 30.7% in 1 year. AUST (managed risk) returned 10.5%. FAIR (ESG/ethical) returned -4.7%. Within the Australian equity universe, factor and strategy tilts have produced very different outcomes — the naive assumption that all Australian equity funds move together is wrong.
Most active funds have underperformed. The notable exceptions are DACE (20.8% vs 16.1% for the index over 1Y) and MQAE (roughly in line but at a 0.03% fee). The majority of active Australian equity funds — particularly those charging 0.78%-0.99% — have underperformed the ASX 200 index over their respective histories. The burden of proof for active management in Australian equities remains high.
Small caps beat large caps in 2025-2026. VSO returned 23.7% and SMLL returned 35.7% — well ahead of the ASX 200's 16.1%. This contrasts with the longer-term 5-year picture, where large-cap-tilted funds like VLC (62.1%) and ILC (61.0%) have outperformed small-cap funds.
Sources and Disclaimer
Data source: All fund data (AUM, MER, returns) sourced from CBOE Australia, February 2026. Returns are cumulative total returns (including distributions reinvested) to February 2026.
Disclaimer: This article is general information only and does not constitute financial advice. Past performance is not indicative of future performance. All investments carry risk, including the potential loss of capital. Geared and inverse products carry additional and material risks beyond standard equity investment. Readers should consider their own circumstances and seek professional financial advice before making investment decisions. ReviewETF.com.au does not hold an Australian Financial Services Licence and does not provide personal financial advice.