Australia's Most Popular ETFs Aren't Always the Best — Here Are the Alternatives

Australians have poured over $330 billion into ETFs. But the most popular funds — the ones with the most money — aren't necessarily the best option in their category. In many cases, there's a cheaper alternative that does the same thing, or a different fund with better returns.
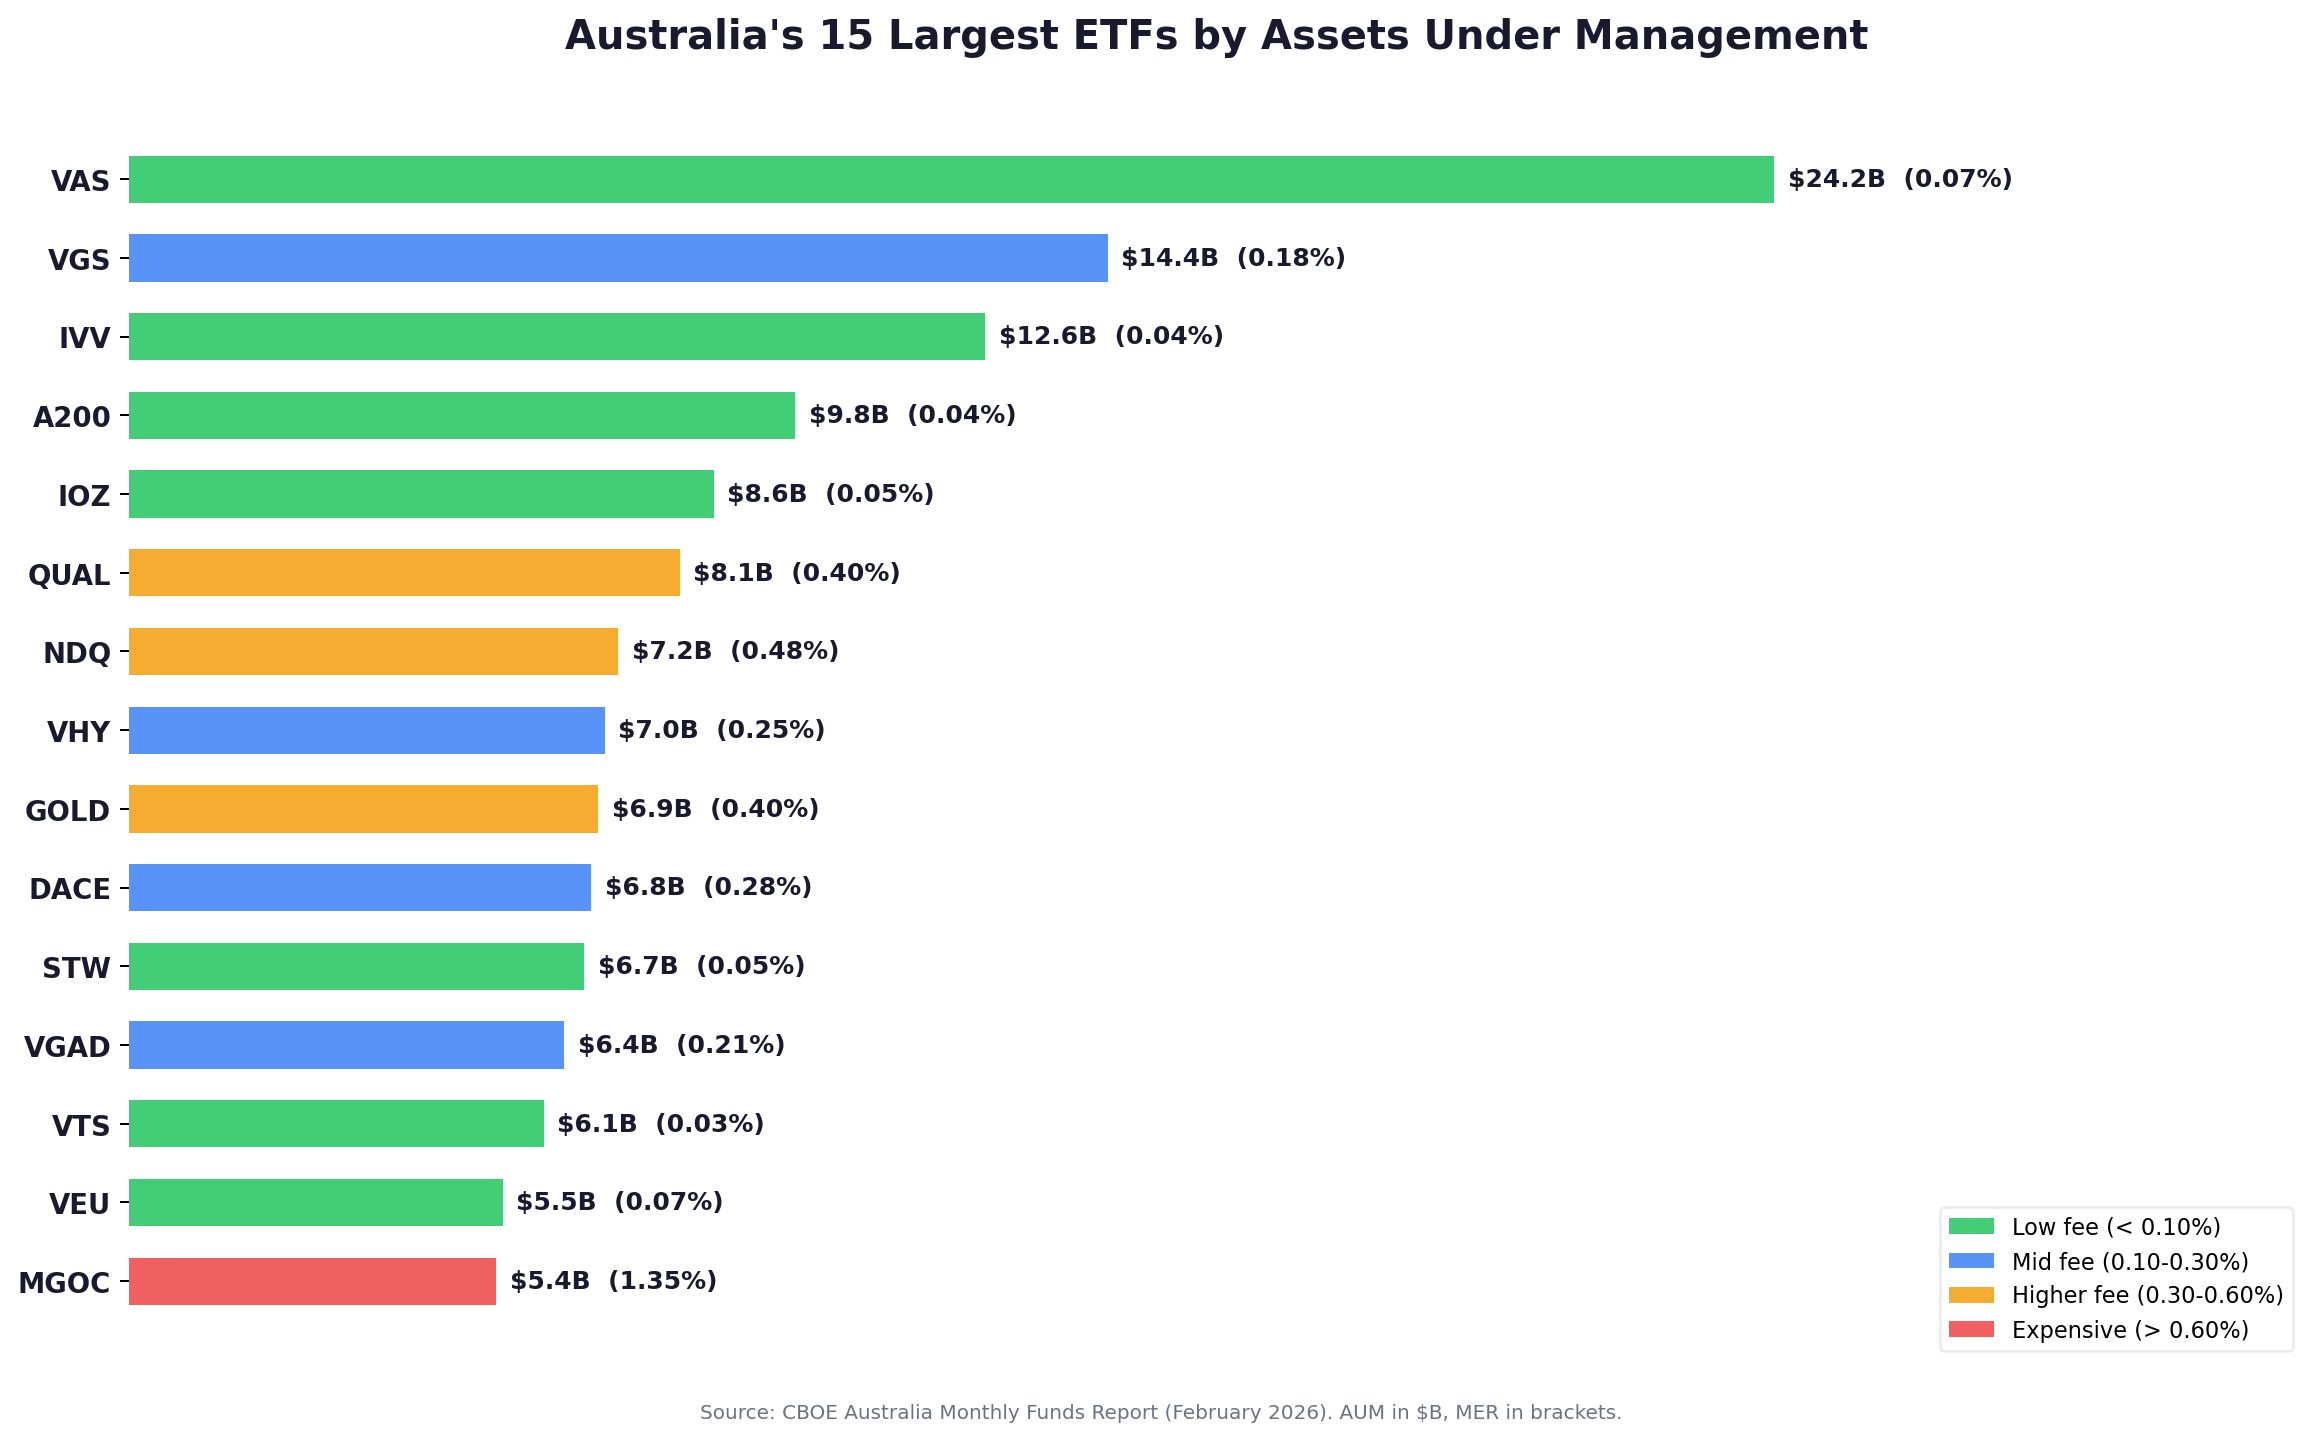
Popularity is driven by brand recognition, first-mover advantage, and marketing — not always by being the best product. We looked at Australia's 15 largest ETFs and asked a simple question: is there a better option?
The Fee Gap: Popular vs Cheaper Alternatives
For nearly every popular ETF, there's a cheaper fund offering the same or very similar exposure. The fee savings range from marginal (0.01%) to enormous (1.17%).

Every Matchup: The Full Data 🥊
1️⃣VGS vs BGBL — International Shares
VGS is Australia's most popular international shares ETF with $14.4 billion. But BetaShares' BGBL does the same thing for less than half the fee.
VGS (Popular) | BGBL (Alternative) | IWLD (Alternative) | |
|---|---|---|---|
MER | 0.18% | 0.08% | 0.09% |
Index | MSCI World ex-AU | FTSE Developed ex-AU | MSCI World |
AUM | $14.4B | $3.5B | $1.5B |
1Y Return | 7.1% | 7.6% | 7.6% |
5Y Return | 92.5% | N/A (launched 2022) | 88.1% |
Fee on $100K | $180/year | $80/year | $90/year |
Verdict: BGBL saves you $100/year per $100K invested and has slightly outperformed over the past year. VGS has a longer track record and deeper liquidity, which matters to some investors. But for new money, BGBL is the better deal.
2️⃣MGOC vs VGS — Global Equities (Active vs Index)
Magellan's MGOC holds $5.4 billion despite being one of the worst-performing large ETFs in Australia. This is the starkest example of popularity not equalling quality.

MGOC (Popular) | VGS (Alternative) | IOO (Alternative) | |
|---|---|---|---|
MER | 1.35% | 0.18% | 0.40% |
1Y Return | -5.5% | 7.1% | 12.2% |
5Y Return | 52.7% | 92.5% | 127.9% |
$100K 5Y ago | $152,700 | $192,500 | $227,900 |
2025 Flows | -$1.3B (outflows) | +$3.5B (inflows) | +$500M (inflows) |
Verdict: $100K in MGOC five years ago is worth $153K. The same money in VGS would be $193K — a $40K difference. In IOO, $228K. Magellan charges 7.5x the fee of VGS and has delivered roughly half the return. Investors are leaving — MGOC had the largest outflows of any ETF in 2025 at $1.3 billion.
3️⃣NDQ vs FANG — US Tech/Nasdaq
NDQ is the go-to Nasdaq 100 ETF with $7.2 billion. But FANG has actually beaten it over 5 years with a lower fee.
NDQ (Popular) | FANG (Alternative) | |
|---|---|---|
MER | 0.48% | 0.35% |
Index | Nasdaq 100 | NYSE FANG+ |
AUM | $7.2B | $1.3B |
1Y Return | 6.0% | 0.3% |
5Y Return | 107.9% | 115.2% |
Holdings | 100 stocks | 10 stocks |
Verdict: FANG is cheaper and has beaten NDQ over 5 years, but it's a much more concentrated fund (10 mega-cap tech stocks vs 100). NDQ is more diversified. FANG is higher risk, higher reward. This one depends on your conviction — NDQ is the safer bet for broad tech exposure.
4️⃣GOLD vs PMGOLD — Gold
GOLD holds $6.9 billion — but Perth Mint's PMGOLD gives you the same gold exposure at a fraction of the fee.
GOLD (Popular) | PMGOLD (Alternative) | |
|---|---|---|
MER | 0.40% | 0.15% |
AUM | $6.9B | $2.7B |
1Y Return | 57.9% | 57.8% |
5Y Return | 216.5% | 219.3% |
Fee on $100K | $400/year | $150/year |
Verdict: Nearly identical returns, but PMGOLD saves you $250/year per $100K. PMGOLD is backed by physical gold held by the Perth Mint (Australian Government guaranteed). There's no good reason to pay 0.40% when you can pay 0.15% for the same thing.
5️⃣ETHI vs VESG — Ethical/ESG
ETHI is the most popular ethical ETF with $3.6 billion. But Vanguard's VESG has crushed it on both fees and returns.
ETHI (Popular) | VESG (Alternative) | |
|---|---|---|
MER | 0.59% | 0.18% |
AUM | $3.6B | $1.3B |
1Y Return | -4.0% | 6.6% |
5Y Return | 63.2% | 86.5% |
Fee on $100K | $590/year | $180/year |
Verdict: VESG outperformed ETHI by 23 percentage points over 5 years while charging less than a third of the fee. Different screening methodologies explain some of the return gap, but not the fee gap. VESG is the clear winner on the numbers.
6️⃣VDHG vs DHHF — Diversified High Growth
VDHG is the OG one-fund portfolio with $3.7 billion. DHHF does the same thing — 100% growth allocation — for a lower fee with better returns.
VDHG (Popular) | DHHF (Alternative) | |
|---|---|---|
MER | 0.27% | 0.19% |
Allocation | 90% growth / 10% bonds | 100% growth |
AUM | $3.7B | $1.2B |
1Y Return | 13.5% | 11.7% |
5Y Return | 56.4% | 70.9% |
Verdict: DHHF has beaten VDHG by 14.5 percentage points over 5 years, driven by its 100% growth allocation (no bond drag) and lower fee. VDHG includes a 10% bond allocation which softens volatility but has cost returns. If you're a long-term growth investor and are comfortable with 100% in growth assets, DHHF is the better product.
7️⃣STW vs A200 — Australian Shares
STW is Australia's original ETF (launched 2001) with $6.7 billion. A200 does the same thing cheaper.
STW (Popular) | A200 (Alternative) | |
|---|---|---|
MER | 0.05% | 0.04% |
AUM | $6.7B | $9.8B |
1Y Return | 15.5% | 16.1% |
5Y Return | 57.4% | 59.6% |
Verdict: A200 has already overtaken STW in AUM ($9.8B vs $6.7B) — the market is figuring this out. Lower fee, better returns. STW only survives because of legacy holders who would trigger CGT by switching.
8️⃣AAA vs BILL — Cash
AAA is the most popular cash ETF with $5.0 billion. But iShares' BILL charges less than half the fee.
AAA (Popular) | BILL (Alternative) | |
|---|---|---|
MER | 0.18% | 0.07% |
AUM | $5.0B | $1.2B |
1Y Return | 3.9% | 3.9% |
5Y Return | 14.7% | 14.2% |
Verdict: Near-identical returns, but BILL charges 0.07% vs AAA's 0.18%. On a $100K cash holding, that's $110/year saved. For a cash product, every basis point of fee comes directly off your yield.
The Scoreboard
Out of 8 matchups where both funds have 5-year data:
Popular ETF | Alternative | Fee Saving | 5Y Return Gap |
|---|---|---|---|
MGOC (1.35%) | VGS (0.18%) | 1.17% saved | VGS wins by 40 points |
ETHI (0.59%) | VESG (0.18%) | 0.41% saved | VESG wins by 23 points |
GOLD (0.40%) | PMGOLD (0.15%) | 0.25% saved | PMGOLD wins by 3 points |
NDQ (0.48%) | FANG (0.35%) | 0.13% saved | FANG wins by 7 points |
VGS (0.18%) | BGBL (0.08%) | 0.10% saved | Too early (BGBL launched 2022) |
VDHG (0.27%) | DHHF (0.19%) | 0.08% saved | DHHF wins by 15 points |
STW (0.05%) | A200 (0.04%) | 0.01% saved | A200 wins by 2 points |
AAA (0.18%) | BILL (0.07%) | 0.11% saved | Draw |
Alternative won on returns: 5 out of 8 (MGOC/VGS, ETHI/VESG, STW/A200, VDHG/DHHF, GOLD/PMGOLD)
Popular fund won on returns: 2 out of 8 (VHY/IHD, QUAL/QLTY)
Draw: 1 (AAA/BILL)
✅The cheaper alternative won on returns more often than not. And even when the popular fund won on returns (VHY, QUAL), they charge higher fees to deliver that edge.
Why Popular Doesn't Mean Best
Three forces explain why the biggest ETFs aren't always the best:
➡️First-mover advantage. VGS launched in 2014. BGBL launched in 2022. VGS had an 8-year head start to accumulate assets, even though BGBL charges less than half. A200 is steadily overtaking STW because it launched with a lower fee — but it took years.
➡️Brand loyalty. Vanguard and BlackRock are trusted brands. Investors pick VGS over BGBL because they know Vanguard. That's a valid reason — but it's not a financial reason.
➡️Inertia. Switching ETFs triggers a capital gains tax event. Many investors hold the "wrong" fund simply because selling would cost more than the fee saving. This is actually rational.
What This Means for You
If you're investing new money: check whether there's a cheaper alternative that does the same thing before defaulting to the biggest fund. The biggest isn't always the best.
If you already hold a popular fund: don't panic-sell. The CGT from switching likely outweighs the fee saving, especially for small differences (VGS → BGBL, STW → A200). The exception is MGOC — the performance gap is so wide that the CGT cost may be worth it.
The two clearest switches for new money:
VGS → BGBL (saves 0.10%, same exposure)
GOLD → PMGOLD (saves 0.25%, same gold)
AAA → BILL (saves 0.11%, same cash)
Research every ETF mentioned in this article on ReviewETF — compare fees, performance, and holdings across all 464 ASX-listed ETFs.
Sources: CBOE Australia Monthly Funds Report (February 2026), BetaShares, BlackRock Australia, Vanguard Australia, Perth Mint, ReviewETF.com.au.
No fund manager wrote this article. No issuer is paying for placement. This is independent analysis based on publicly available data.
This article is general information only and does not constitute financial advice. Consider your own circumstances and seek professional advice before making investment decisions.