
Broad core ETFs are built to hold. Across 12 big core funds, five-year returns to 30 September 2026 ranged from +33% to +88%, and none lost money. Thematic and sector ETFs need a view on timing. Across 25 of them, results ranged from −14% to +352%, and last year's return was on average 24 percentage points away from their five-year trend. Hold the core; manage the satellites.
Two kinds of ETF, two different jobs
A core ETF tracks a whole market: the ASX 200, the S&P 500, the developed world, or a mix of all of them in one fund. Think VAS, A200, IVV, VGS or DHHF. Its returns come from owning economies over decades.
A thematic or sector ETF owns one slice: semiconductors, gold miners, Asian tech, small companies, clean energy. Think SEMI, GDX, ASIA or ATEC. Its returns come from a trend, and trends start and end.
To test the difference, we took 12 widely held core ETFs and 25 thematic, sector and regional ETFs, all with at least five years of history, and compared their returns using the TMX monthly report to 30 September 2026.
Core funds cluster. Themes scatter.
Best, average and worst: core vs thematic ETFs
The thematic group earned more on average, but that average hides an enormous spread. The best, SEMI, returned +352% in five years. The worst, CLNE (clean energy), lost 14%. ATEC (Australian tech) and NDIA (India) were roughly flat after five years.
In the core group, the worst result was VDGR at +33%, and that fund is 30% bonds by design. Picking any one of them blindly would have worked out reasonably. Picking a theme blindly was a coin toss between a big win and a lost five years.
Core funds land close together; themes do not
The timing test: last year vs the long-run trend
A simple way to see whether timing matters is to compare each fund's last 12 months with its average year over five years. We call the gap drift. Low drift means the fund just compounds. High drift means it moves in bursts, hot then cold.
- Core ETFs: average drift of 3.1 points. DHHF returned 8.1% last year against 9.2% a year over five years. VDHG: 7.5% against 7.7%.
- Thematic ETFs: average drift of 24.0 points, eight times as much.
Last 12 months minus the 5-year average year
IKO (South Korea) returned +125% last year against about 20% a year over five. ATEC fell 33% last year. GDX has been one of the best funds over five years, at about 26% a year, but returned only 10.5% in the latest 12 months as gold miners cooled. When you bought and sold these funds mattered far more than whether you owned them.
The hold list: funds built to compound
| ETF | Exposure | Fee | 1 year | 5 years (a year) |
|---|---|---|---|---|
| A200 | ASX 200 | 0.04% | +2.9% | +6.9% |
| VAS | ASX 300 | 0.07% | +2.2% | +6.5% |
| IVV | S&P 500 | 0.04% | +10.1% | +13.4% |
| VGS | Developed world | 0.18% | +10.1% | +11.8% |
| VEU | World outside US | 0.07% | +14.0% | +9.2% |
| DHHF | All-in-one, 100% growth | 0.19% | +8.1% | +9.2% |
| VDHG | All-in-one, 90% growth | 0.27% | +7.5% | +7.7% |
Total returns to 30 September 2026. Source: TMX Australia monthly funds report.
Low fees, thousands of companies, and returns that track the economy. Australian shares have had a quiet year, but that is a normal part of holding a market, not a reason to sell it.
The watch list: funds where timing matters
| ETF | Theme | Fee | 1 year | 5 years (a year) |
|---|---|---|---|---|
| SEMI | Semiconductors | 0.45% | +109.0% | +35.2% |
| ASIA | Asian tech | 0.67% | +55.4% | +17.6% |
| HACK | Cybersecurity | 0.67% | +25.8% | +15.2% |
| GDX | Gold miners | 0.53% | +10.5% | +26.5% |
| SMLL | Australian small companies | 0.39% | +4.3% | +4.7% |
| ATEC | Australian tech | 0.48% | −33.0% | −1.1% |
| CLNE | Clean energy | 0.65% | +15.2% | −3.0% |
Total returns to 30 September 2026. Source: TMX Australia monthly funds report.
Average fee: core vs thematic
Themes also cost more, about 0.55% a year on average against 0.12% for the core. That is another reason not to hold a fading theme for years out of habit.
What "trade" really means here
This is not day trading. For satellite holdings, it means having a rule for when you get in and when you get out, and reviewing it regularly. ETF Adviser's approach is to follow the trend: markets tend to move through quiet bases and then trends, so the aim is to buy a theme as a new uptrend begins and step aside when it breaks down.
- Enter on strength, not on hope. A fund breaking out of a long base is a different proposition from one that has already doubled.
- Have an exit before you buy. A stop-loss or a trend rule stops a fading theme turning into a long-term loss.
- Expect false starts. Some breakouts fail. Small positions keep those mistakes affordable.
- Keep it in proportion. Satellites work best as small positions around a large, steady core.
Putting it together
This is the logic behind core and satellite investing. The core, often most of the portfolio, sits in one or a few broad ETFs and is left alone. The satellites are smaller positions in themes, each with an entry and exit plan. Read more in our guides to building your core and building your satellites, or browse tech, gold and Asia ETFs.
Compare a core fund with two themes →
Common questions
Can you buy and hold thematic ETFs?
You can, but the results vary widely. Over five years to September 2026 thematic ETFs ranged from a 14% loss to a 352% gain. Holding one through a full cycle can mean giving back years of gains, which is why many investors manage them actively.
Which ETFs are best for long-term holding in Australia?
Broad, low-cost funds that own whole markets, such as ASX 200 or ASX 300 trackers, global share ETFs and diversified all-in-one funds. Their returns have been far more consistent than sector or theme funds.
Is it bad to trade ETFs?
Frequent trading of core funds usually adds costs and tax without adding return. For narrow thematic funds, having clear entry and exit rules can make a large difference, because their returns come in bursts.
How much of a portfolio should be in thematic ETFs?
There is no single answer, but most core and satellite investors keep themes as a minority of the portfolio and size each position so that a failed theme cannot do serious damage.
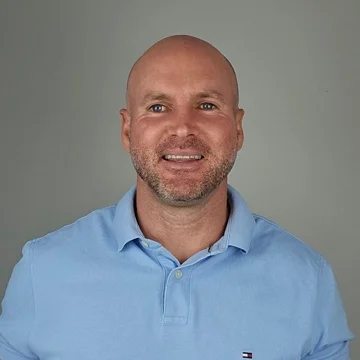
Joshua Stega is a financial adviser with 20 years' experience and the founder of ETF Adviser. He built ReviewETF to make every Australian ETF easy to find and compare.
General information only. It does not take into account your objectives, financial situation or needs. Consider the PDS and TMD before investing. Past performance is not a reliable indicator of future performance. Data as at 30 September 2026.